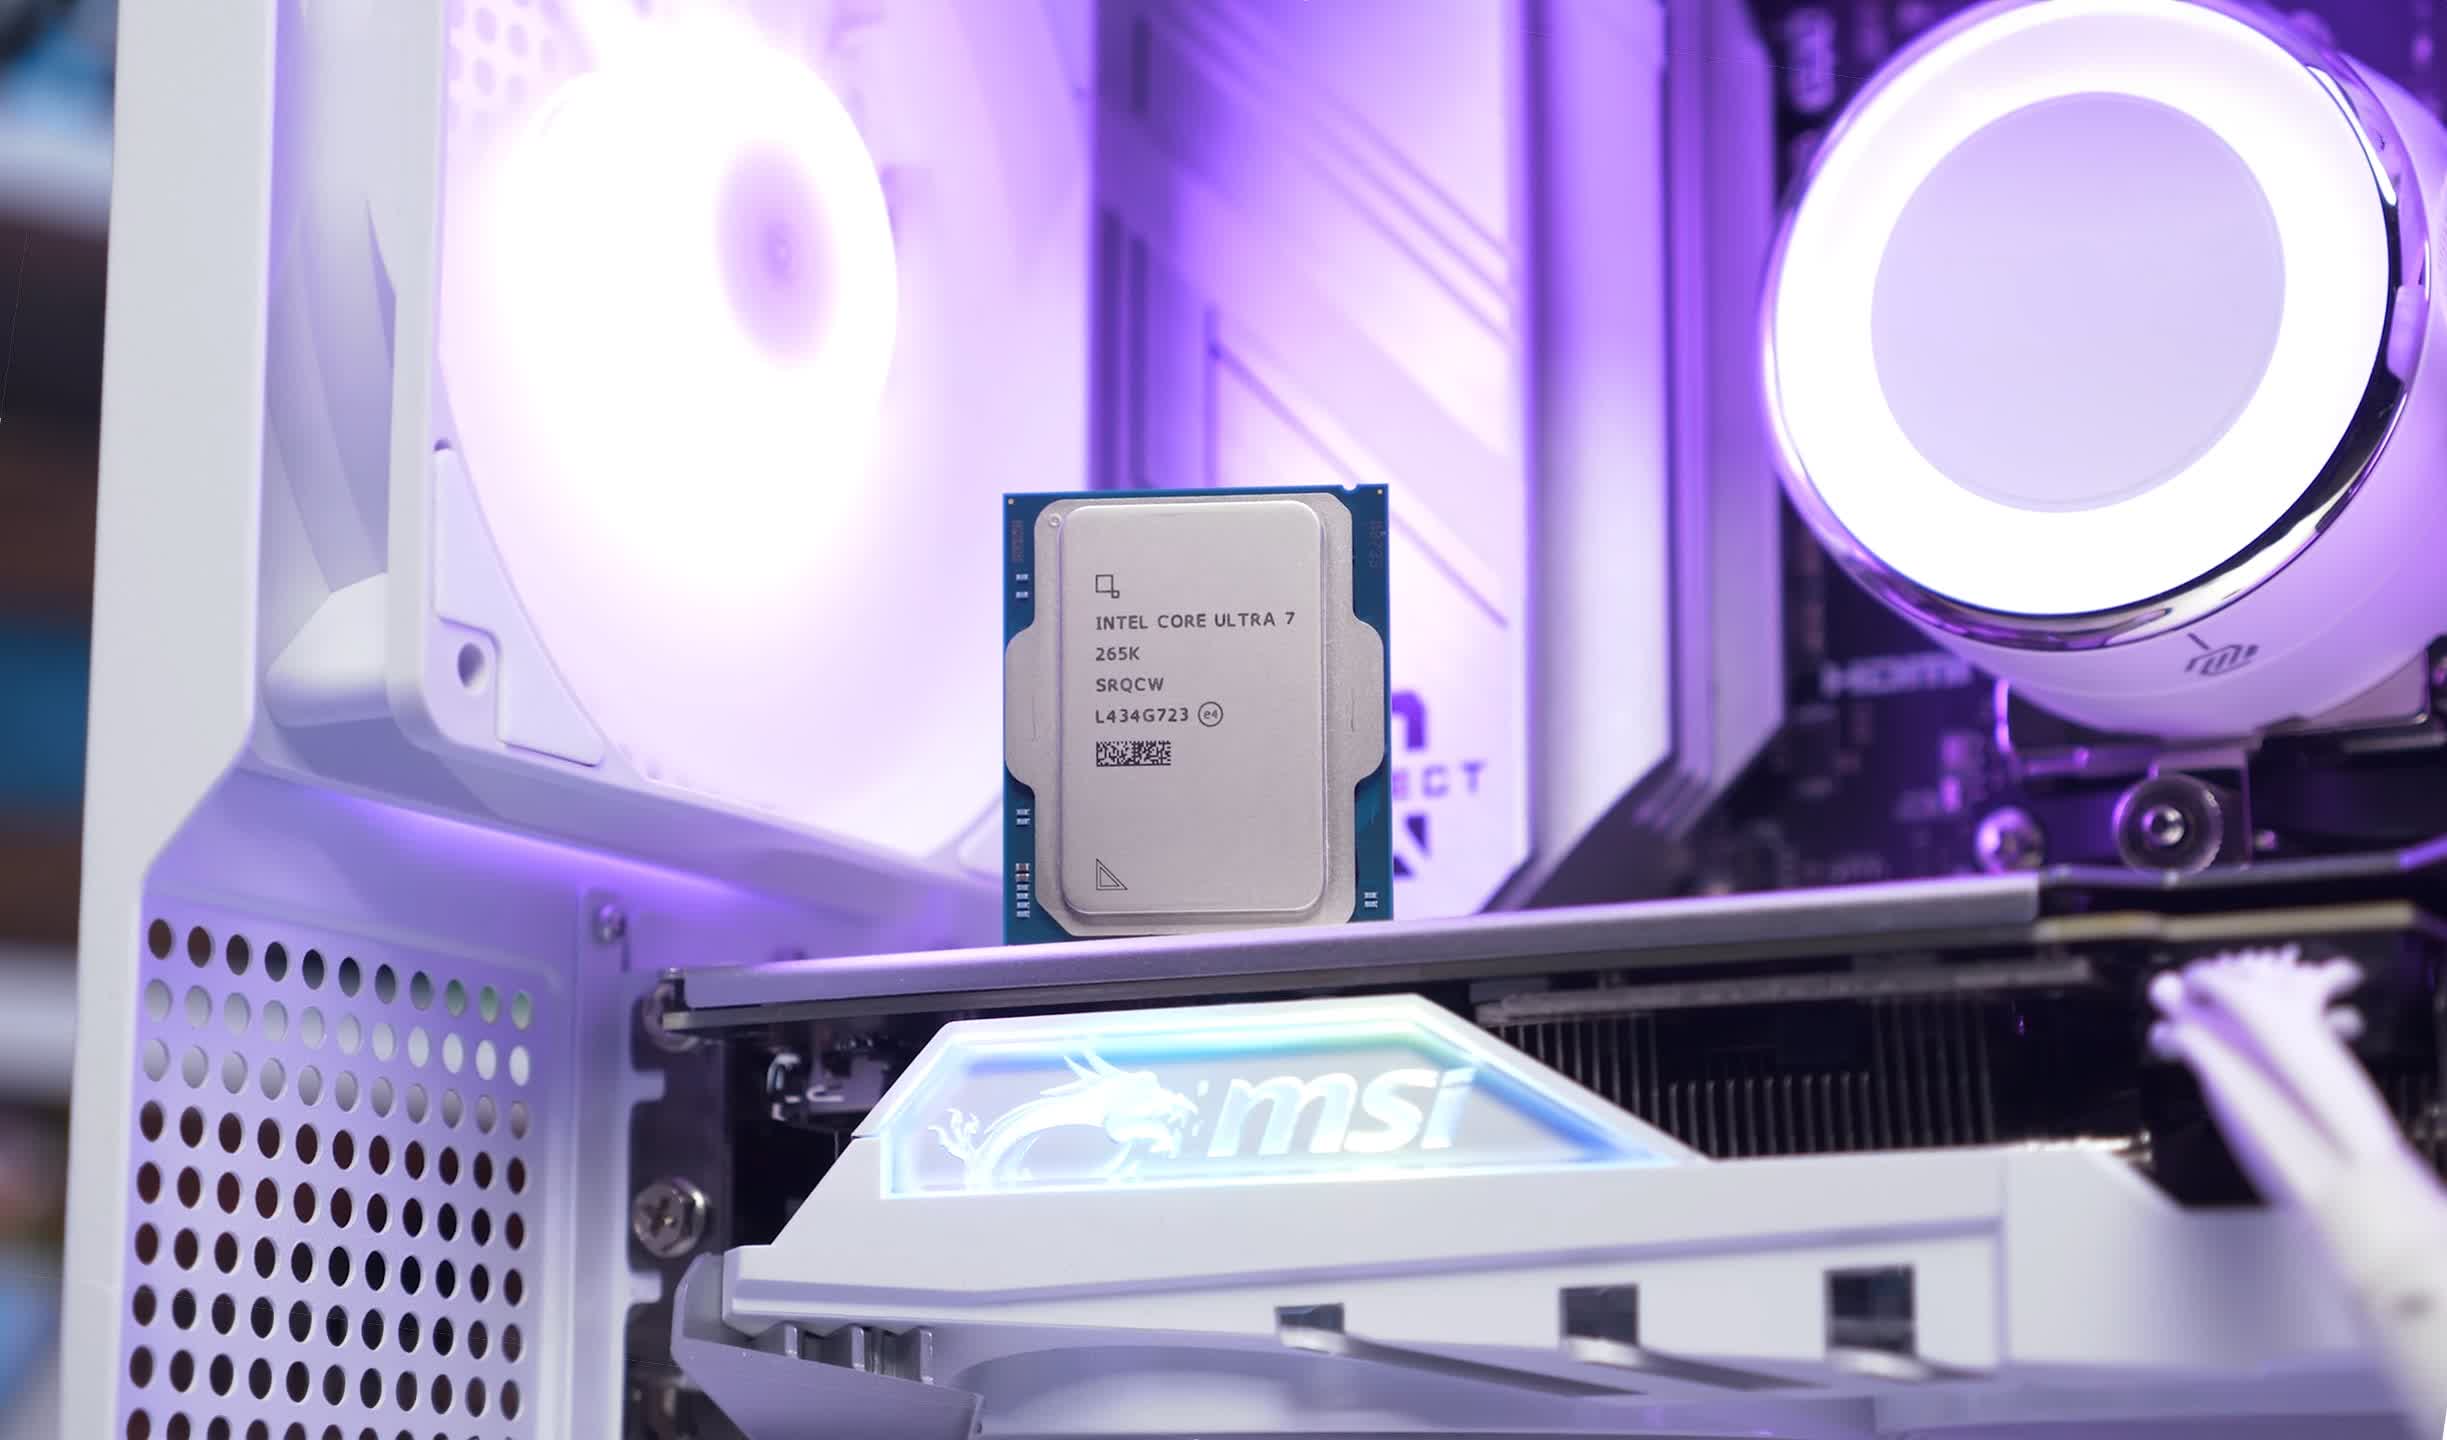
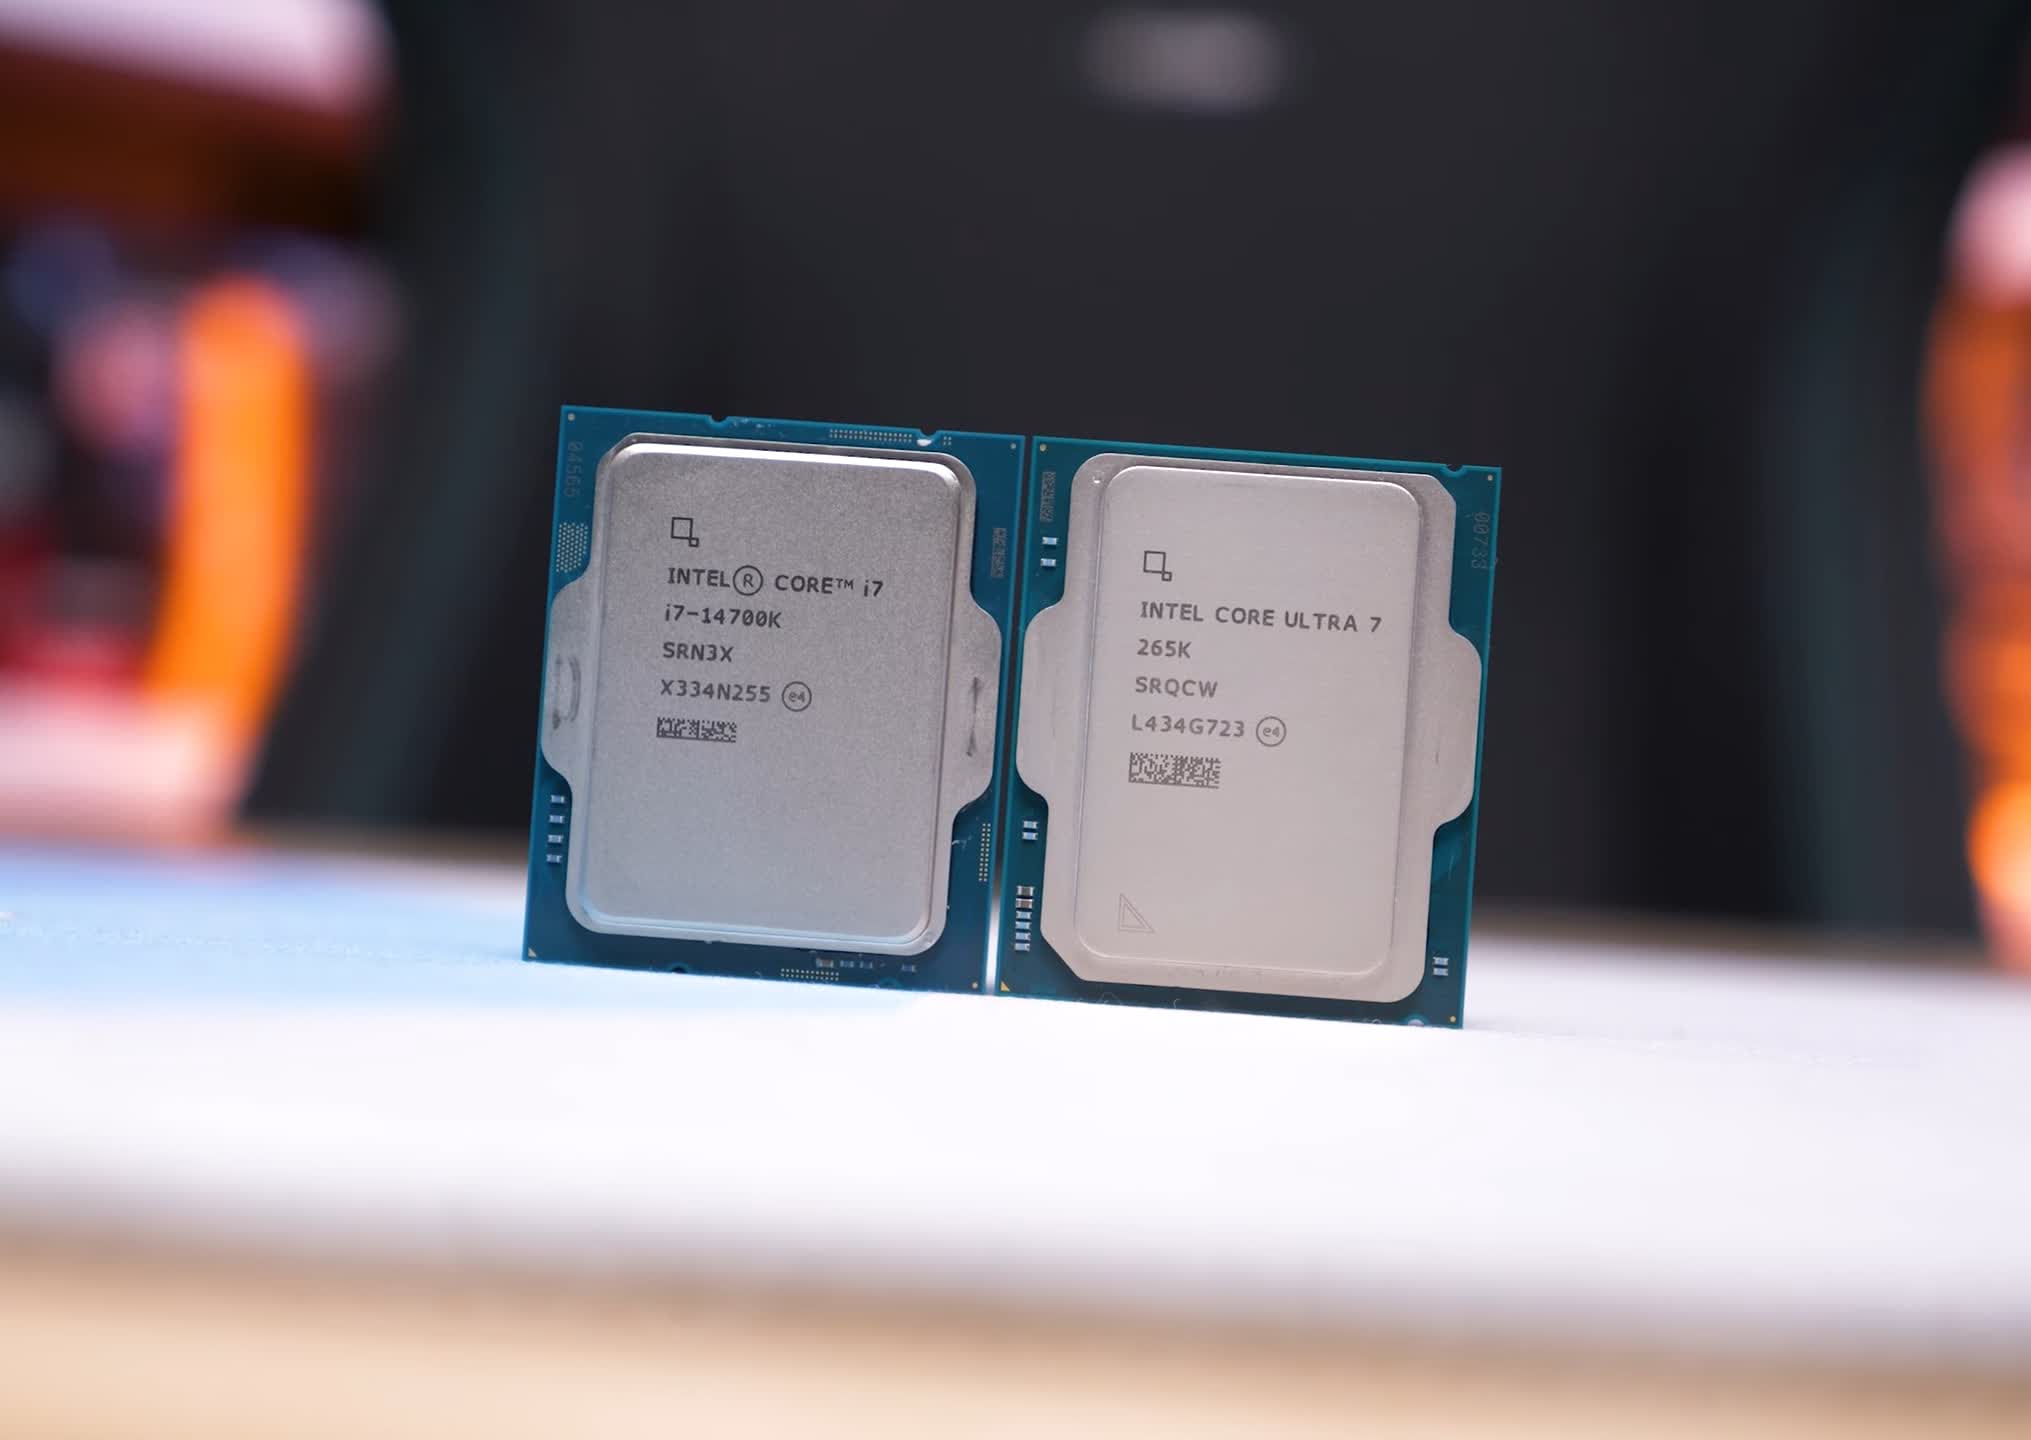
The Intel Core Ultra 7 265K can be considered the successor to the Core i7-14700K. It will be interesting to see how these two compare and, of course, how the 265K stacks up against AMD’s offerings.
The Core Ultra 7 265K features 8 P-Cores with 8 threads, as Hyper-Threading is no longer implemented. These P-Cores operate at a base frequency of 3.9 GHz and can boost up to 5.5 GHz, representing only a 2% frequency reduction compared to the 14700K.
In addition, there are 12 E-Cores with 12 threads, as SMT support is not included. The E-Cores have a base frequency of 3.3 GHz and can reach up to 4.6 GHz, which actually provides a 7% increase over the E-Core frequency on the 14700K.
The processor includes 30 MB of L3 cache and 36 MB of L2 cache. Each P-Core is allocated 3 MB of L2 cache, while the E-Cores receive 4 MB per cluster, with each cluster comprising four E-Cores. The base TDP is set at 125W, with a maximum turbo power of 250W, and Intel prices this at $395 per 1,000 units.
| Processor | Release price | P-core (performance) | E-core (efficiency) | L3 cache | ||||||
|---|---|---|---|---|---|---|---|---|---|---|
| Cores (threads) | Freq. | Turbo | L2 cache | Cores (threads) | Freq. | Turbo | L2 cache | |||
| Core Ultra 9 285K | $600 | 8 (8) | 3.7 GHz | 5.6 GHz | 24 MB | 16 (16) | 3.2 GHz | 4.6 GHz | 16 MB | 36 MB |
| Core Ultra 7 265K | $395 | 8 (8) | 3.9 GHz | 5.5 GHz | 12 (12) | 3.3 GHz | 12 MB | 30 MB | ||
| Core Ultra 5 245K | $310 | 6 (6) | 4.2 GHz | 5.2 GHz | 18 MB | 8 (8) | 3.6 GHz | 8 MB | 24 MB | |
| Core i9-14900K | $600 | 8 (16) | 3.2 GHz | 6.0 GHz | 16 MB | 16 (16) | 2.4 GHz | 4.4 GHz | 16 MB | 36 MB |
| Core i7-14700K | $420 | 8 (16) | 3.4 GHz | 5.6 GHz | 12 (12) | 2.5 GHz | 4.3 GHz | 12 MB | 33 MB | |
| Core i5-14600K | $330 | 6 (12) | 3.5 GHz | 5.3 GHz | 12 MB | 8 (8) | 2.6 GHz | 4.0 GHz | 8 MB | 24 MB |
With Arrow Lake, Intel has moved away from the LGA1700 socket, switching to LGA1851. We covered more information about Intel’s new platform, socket, and testing information in our Core Ultra 9 285K review, so for more details about that check out that review.
Despite the increased pin count, the new socket maintains the same dimensions and cooler mounting hole spacing as LGA1700, ensuring continued compatibility with existing CPU coolers.
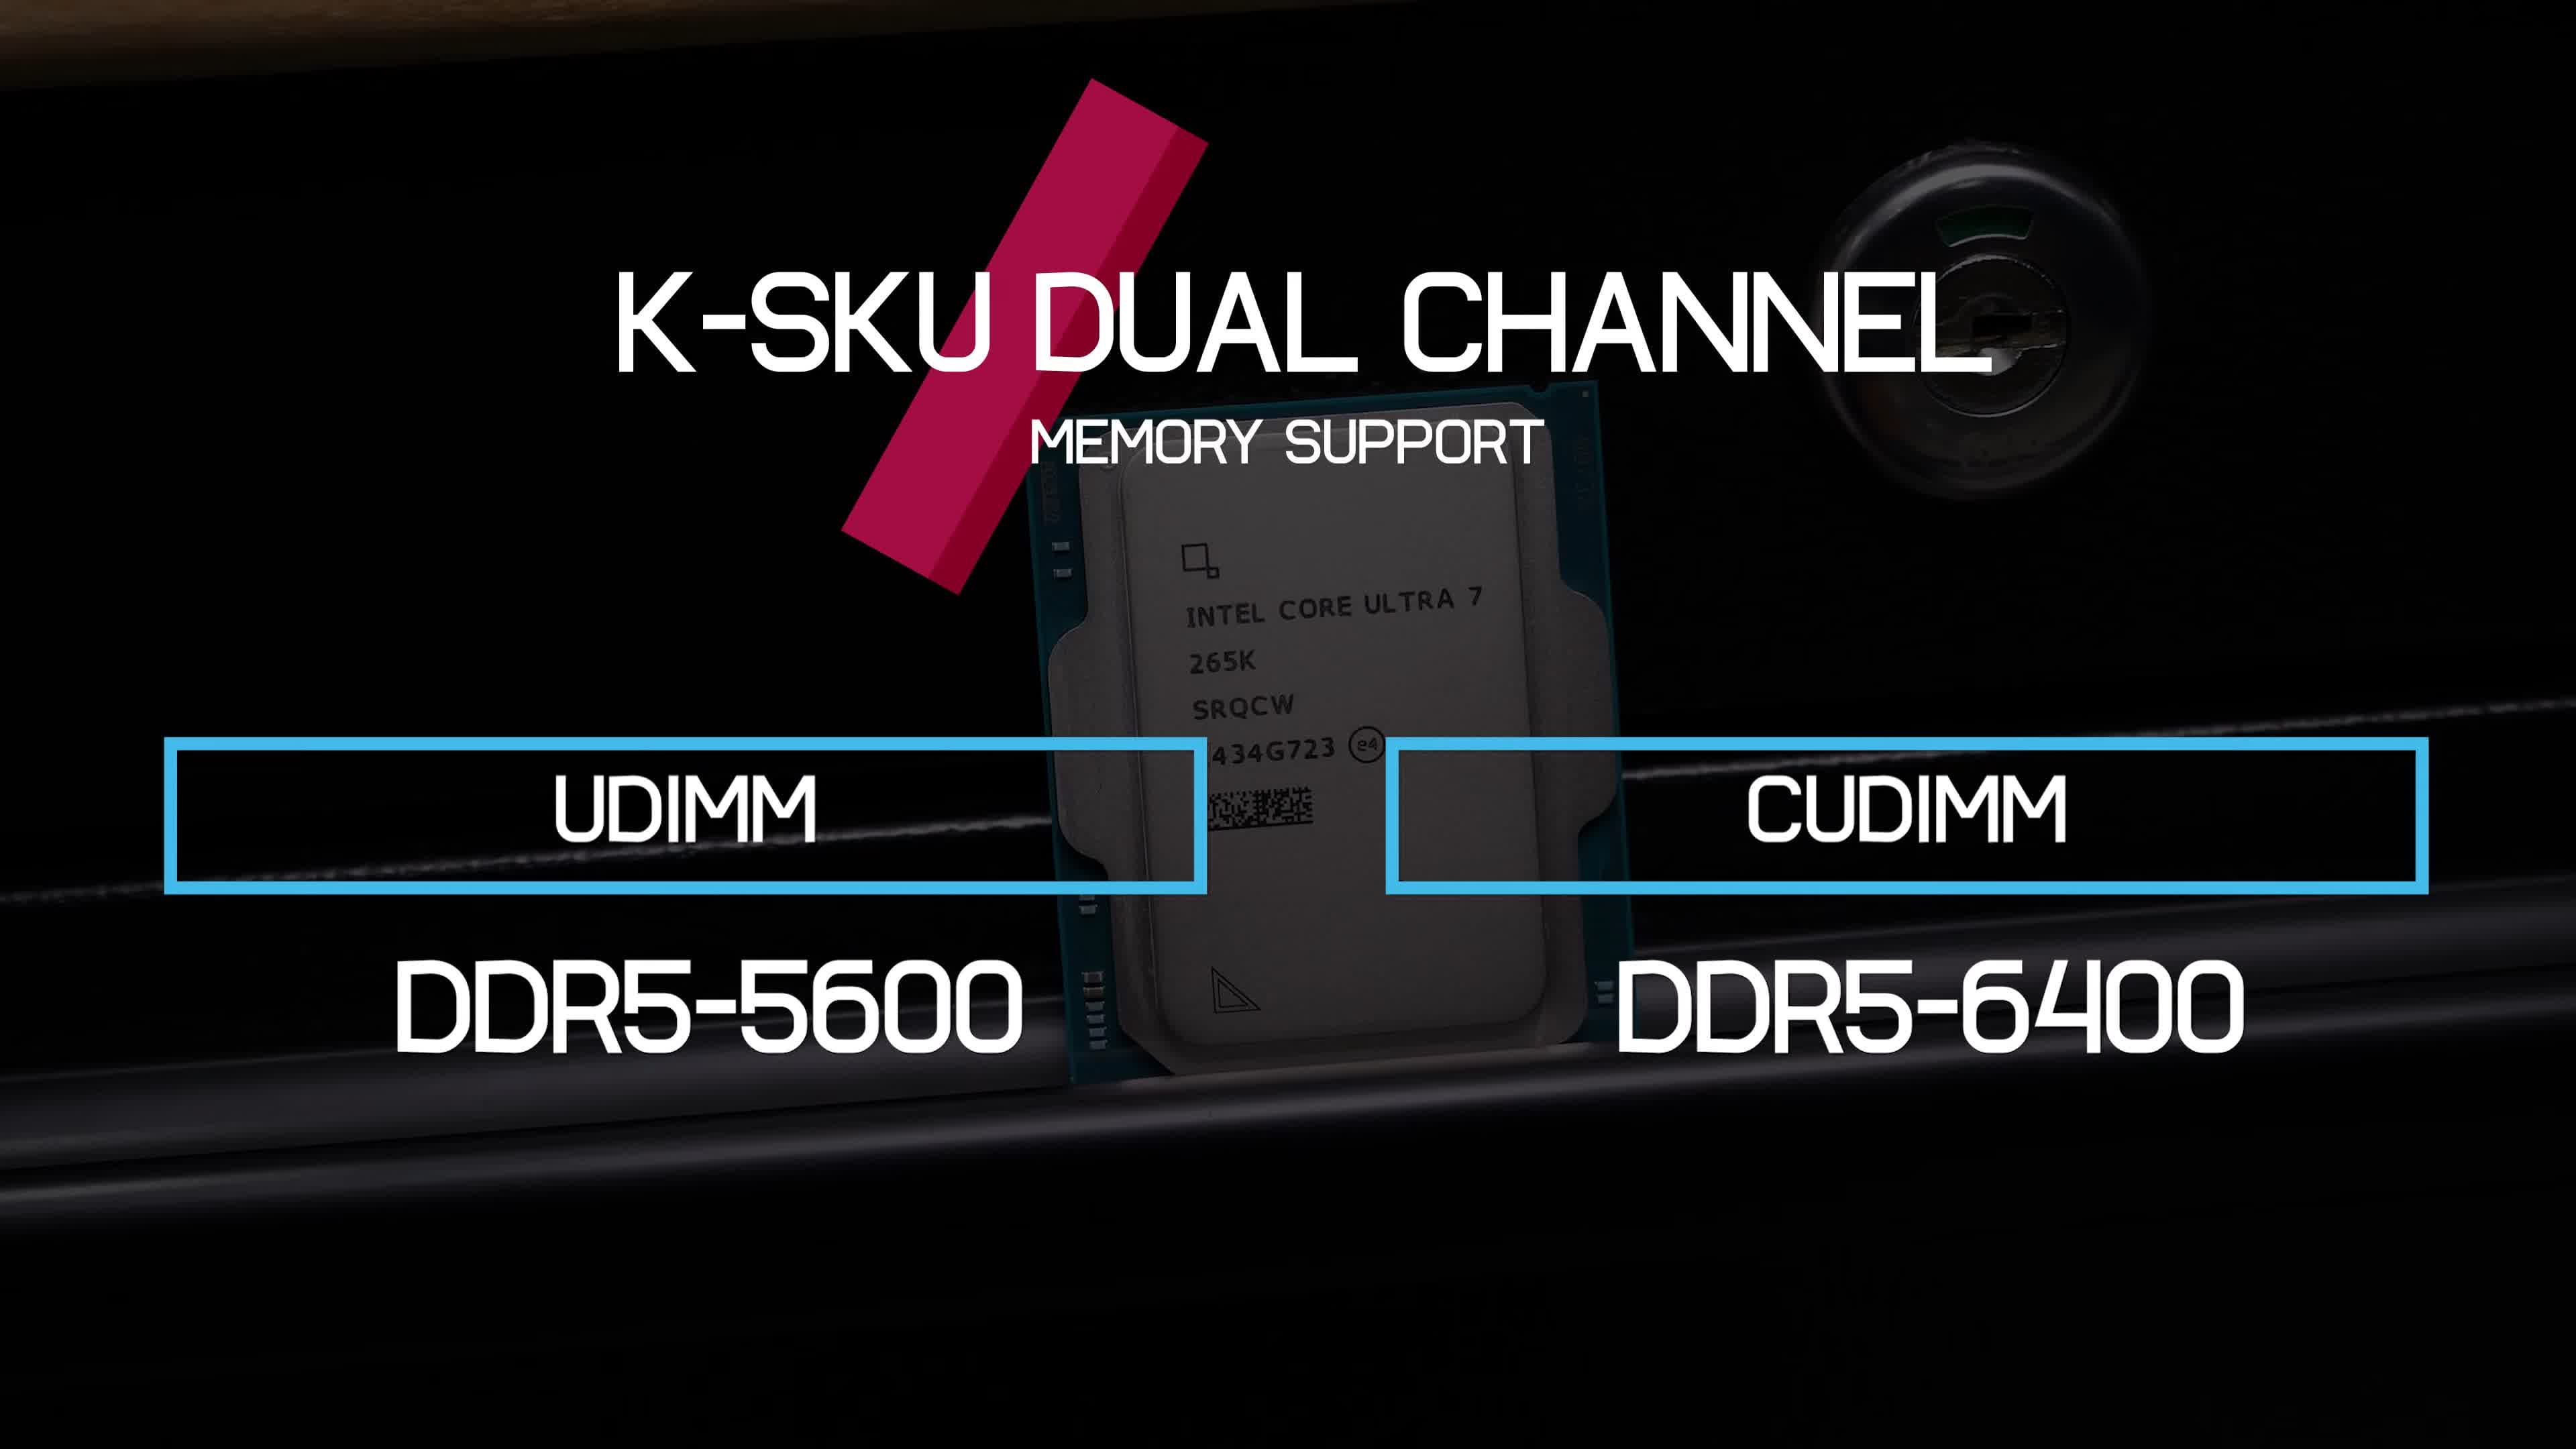
It’s also worth noting that all K-SKU models, which are the only models announced so far, support dual-channel DDR5-5600 UDIMM memory or DDR5-6400 CUDIMM memory. CUDIMM memory includes a small clock driver circuit directly on the module, allowing for more precise timings necessary for higher memory speeds.
All models provide 20 PCIe 5.0 lanes and 4 PCIe 4.0 lanes, along with a Direct Media Interface 4.0 with an 8-lane bus to the chipset. As expected, the K-suffix processors feature an unlocked multiplier and therefore can be overclocked.
Test System Specs
Before we get into the benchmark data, here are the test specs and systems used. One thing to note is that we benchmarked the 285K with both DDR5-7200 and DDR5-8200 memory.
| CPU | Motherboard | Memory |
| AMD Ryzen 7000 Series | Gigabyte X670E Aorus Master [BIOS F33d] | G.Skill Trident Z5 RGB 32GB DDR5-6000 CL30-38-38-96 Windows 11 24H2 |
| AMD Ryzen 5000 Series | MSI MPG X570S Carbon MAX WiFi [BIOS 7D52v19] | G.Skill Ripjaws V Series 32GB DDR4-3600 CL14-15-15-35 Windows 11 24H2 |
| Intel Core Ultra 200S | Asus ROG Maximus Z890 Hero [BIOS 0805] | G.Skill Trident Z5 CK 32GB DDR5-8200 CL40-52-52-131 G.Skill Trident Z5 RGB 32GB DDR5-7200 CL34-45-45-115 Windows 11 23H2 [24H2 = Slower] |
| Intel 12th, 13th & 14th | MSI MPG Z790 Carbon WiFi [BIOS 7D89v1E] | G.Skill Trident Z5 RGB 32GB DDR5-7200 CL34-45-45-115 Windows 11 23H2 [24H2 = Slower] |
| Graphics Card | Power Supply | Storage |
| Asus ROG Strix RTX 4090 OC Edition | Kolink Regulator Gold ATX 3.0 1200W | TeamGroup T-Force Cardea A440 M.2 PCIe Gen4 NVMe SSD 4TB |
| GeForce Game Ready Driver 565.90 WHQL | ||
Productivity Benchmarks
Cinebench Clock Behavior
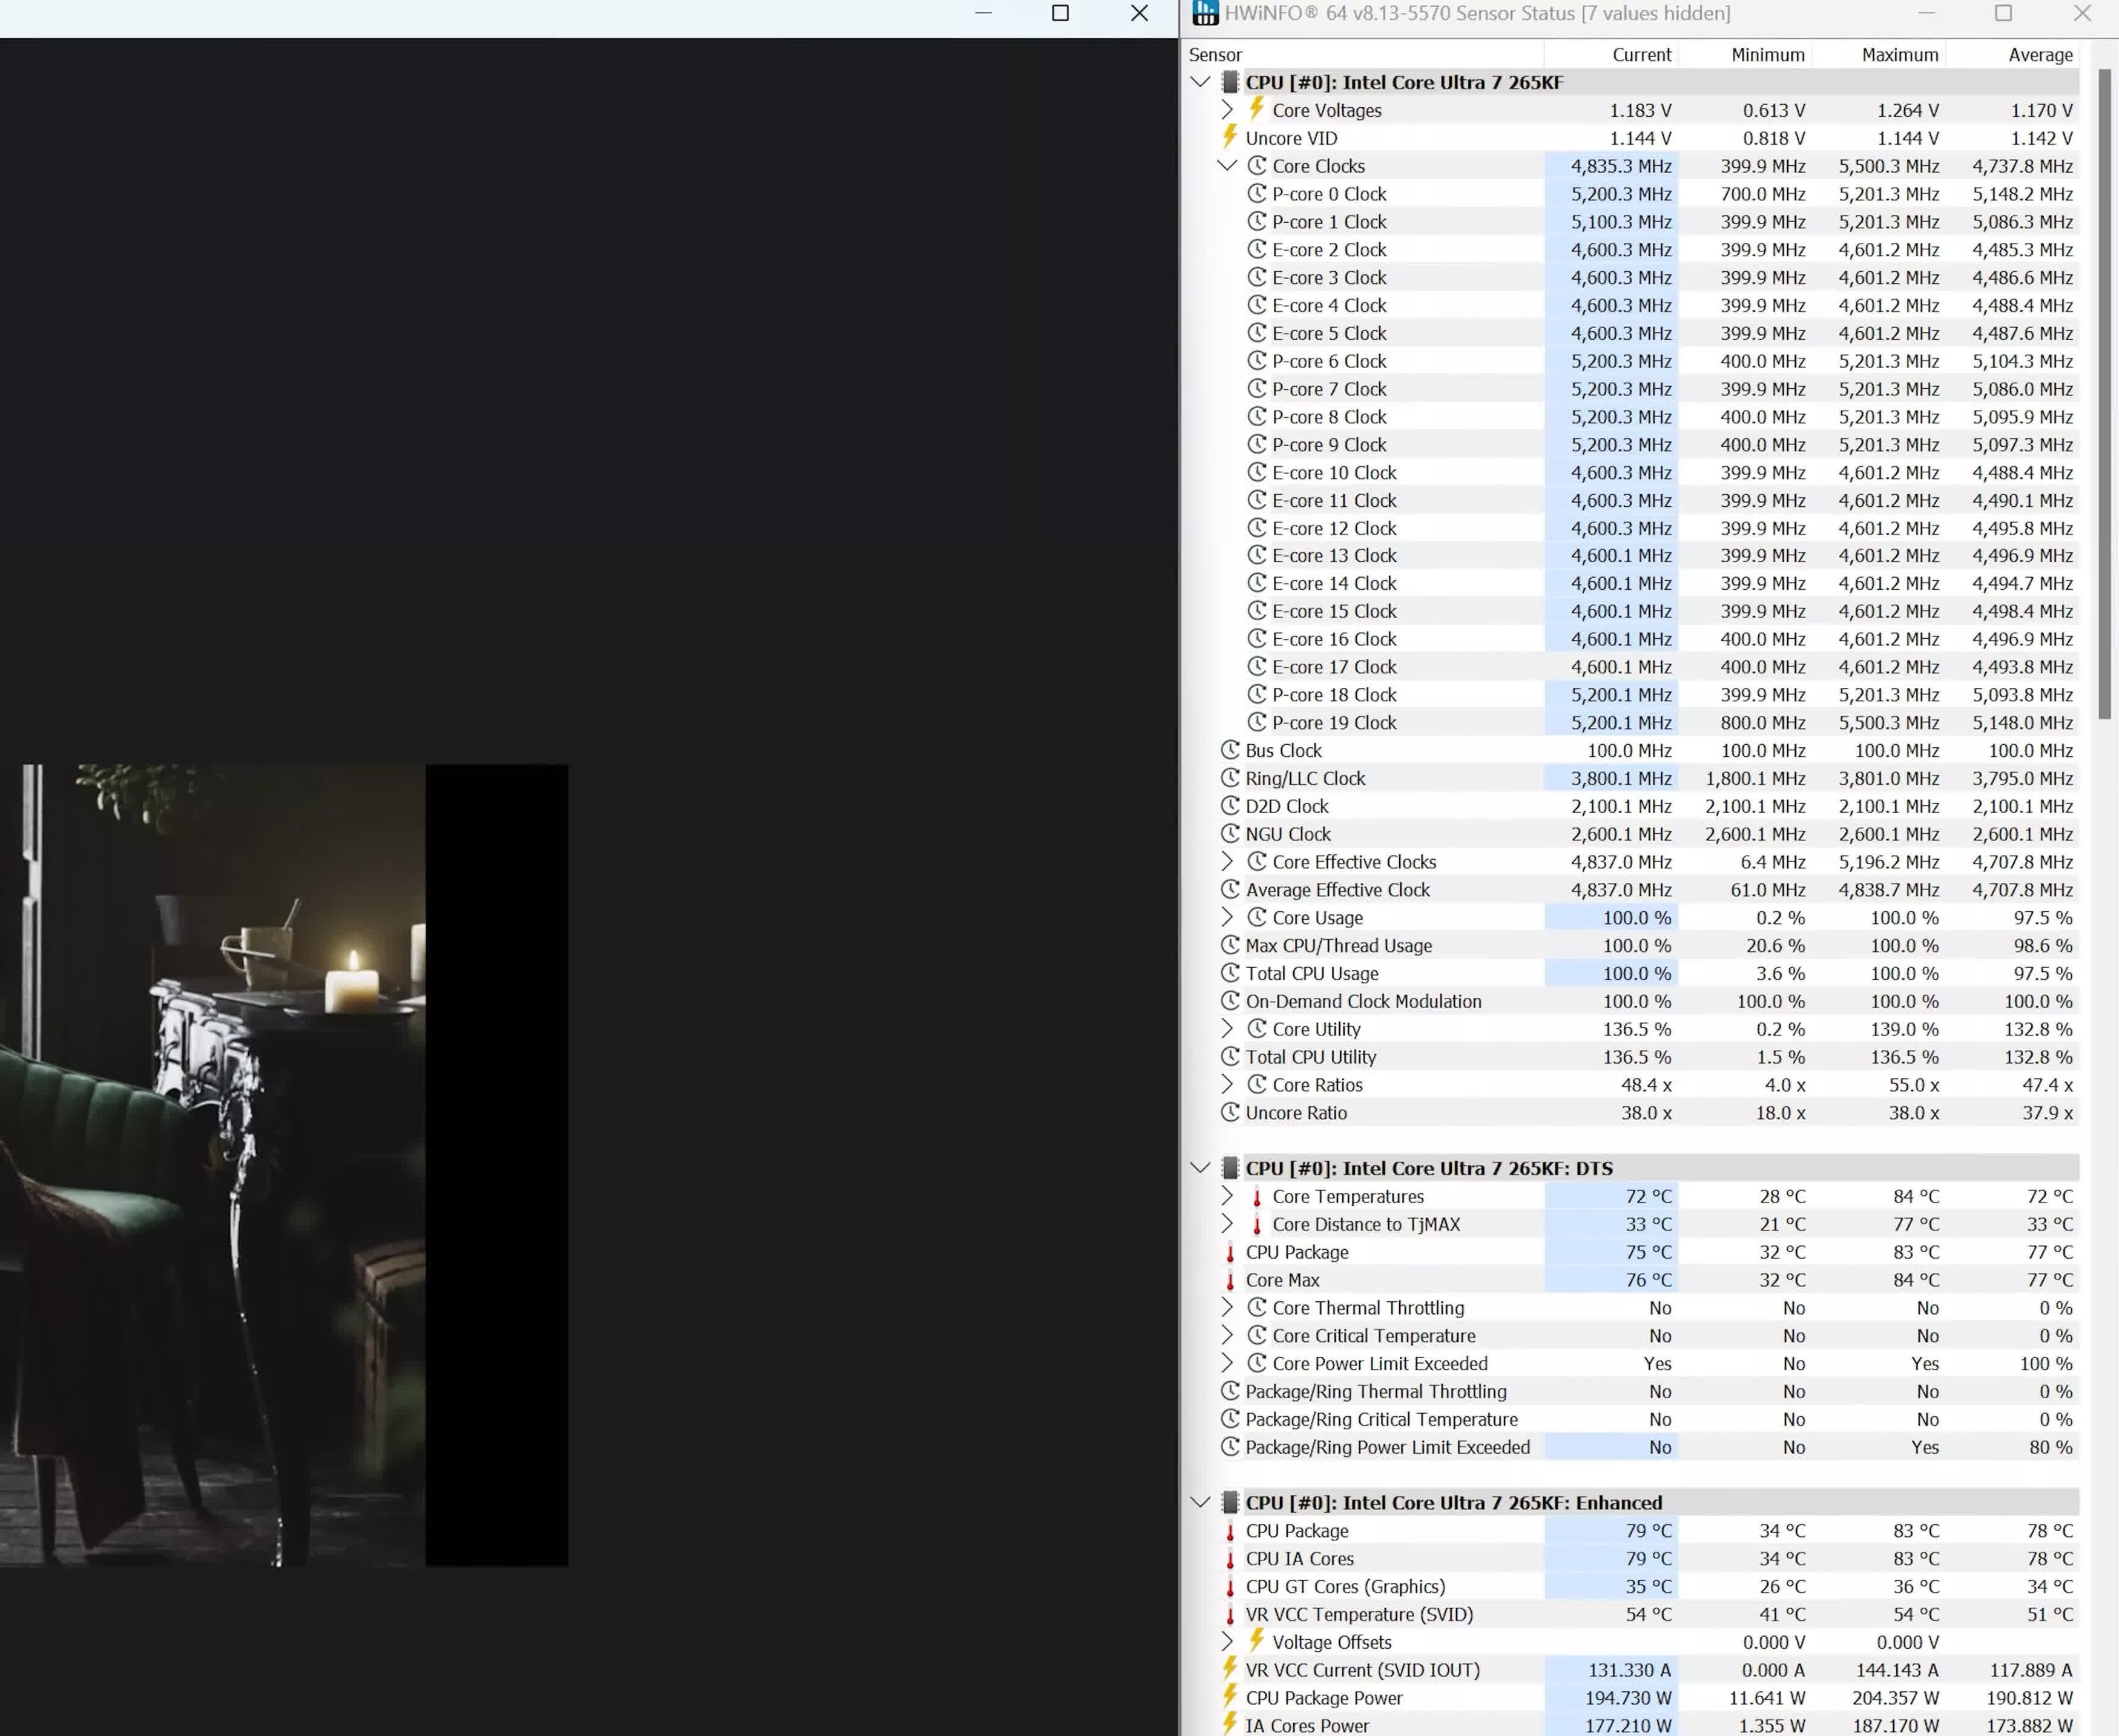
First, let’s examine how the 265K performs under load. For cooling, we’re using the new MSI MAG Coreliquid I360, provided in our review kit and specifically optimized for these new Arrow Lake CPUs. MSI designed a unique bracket that shifts the cold plate northward, allowing for a 3-degree reduction in temperature by better targeting the hot spot on these CPUs.
With the Coreliquid I360 installed, we loaded the 265K with Cinebench and observed an average clock frequency of 4.6 GHz on the E-Cores and 5.2 GHz on the P-Cores, all while remaining within the stock 250W power limit. The CPU peaked at a core temperature of 84°C, comfortably below the 105°C TjMAX.
Cinebench 2024, Multi-Core
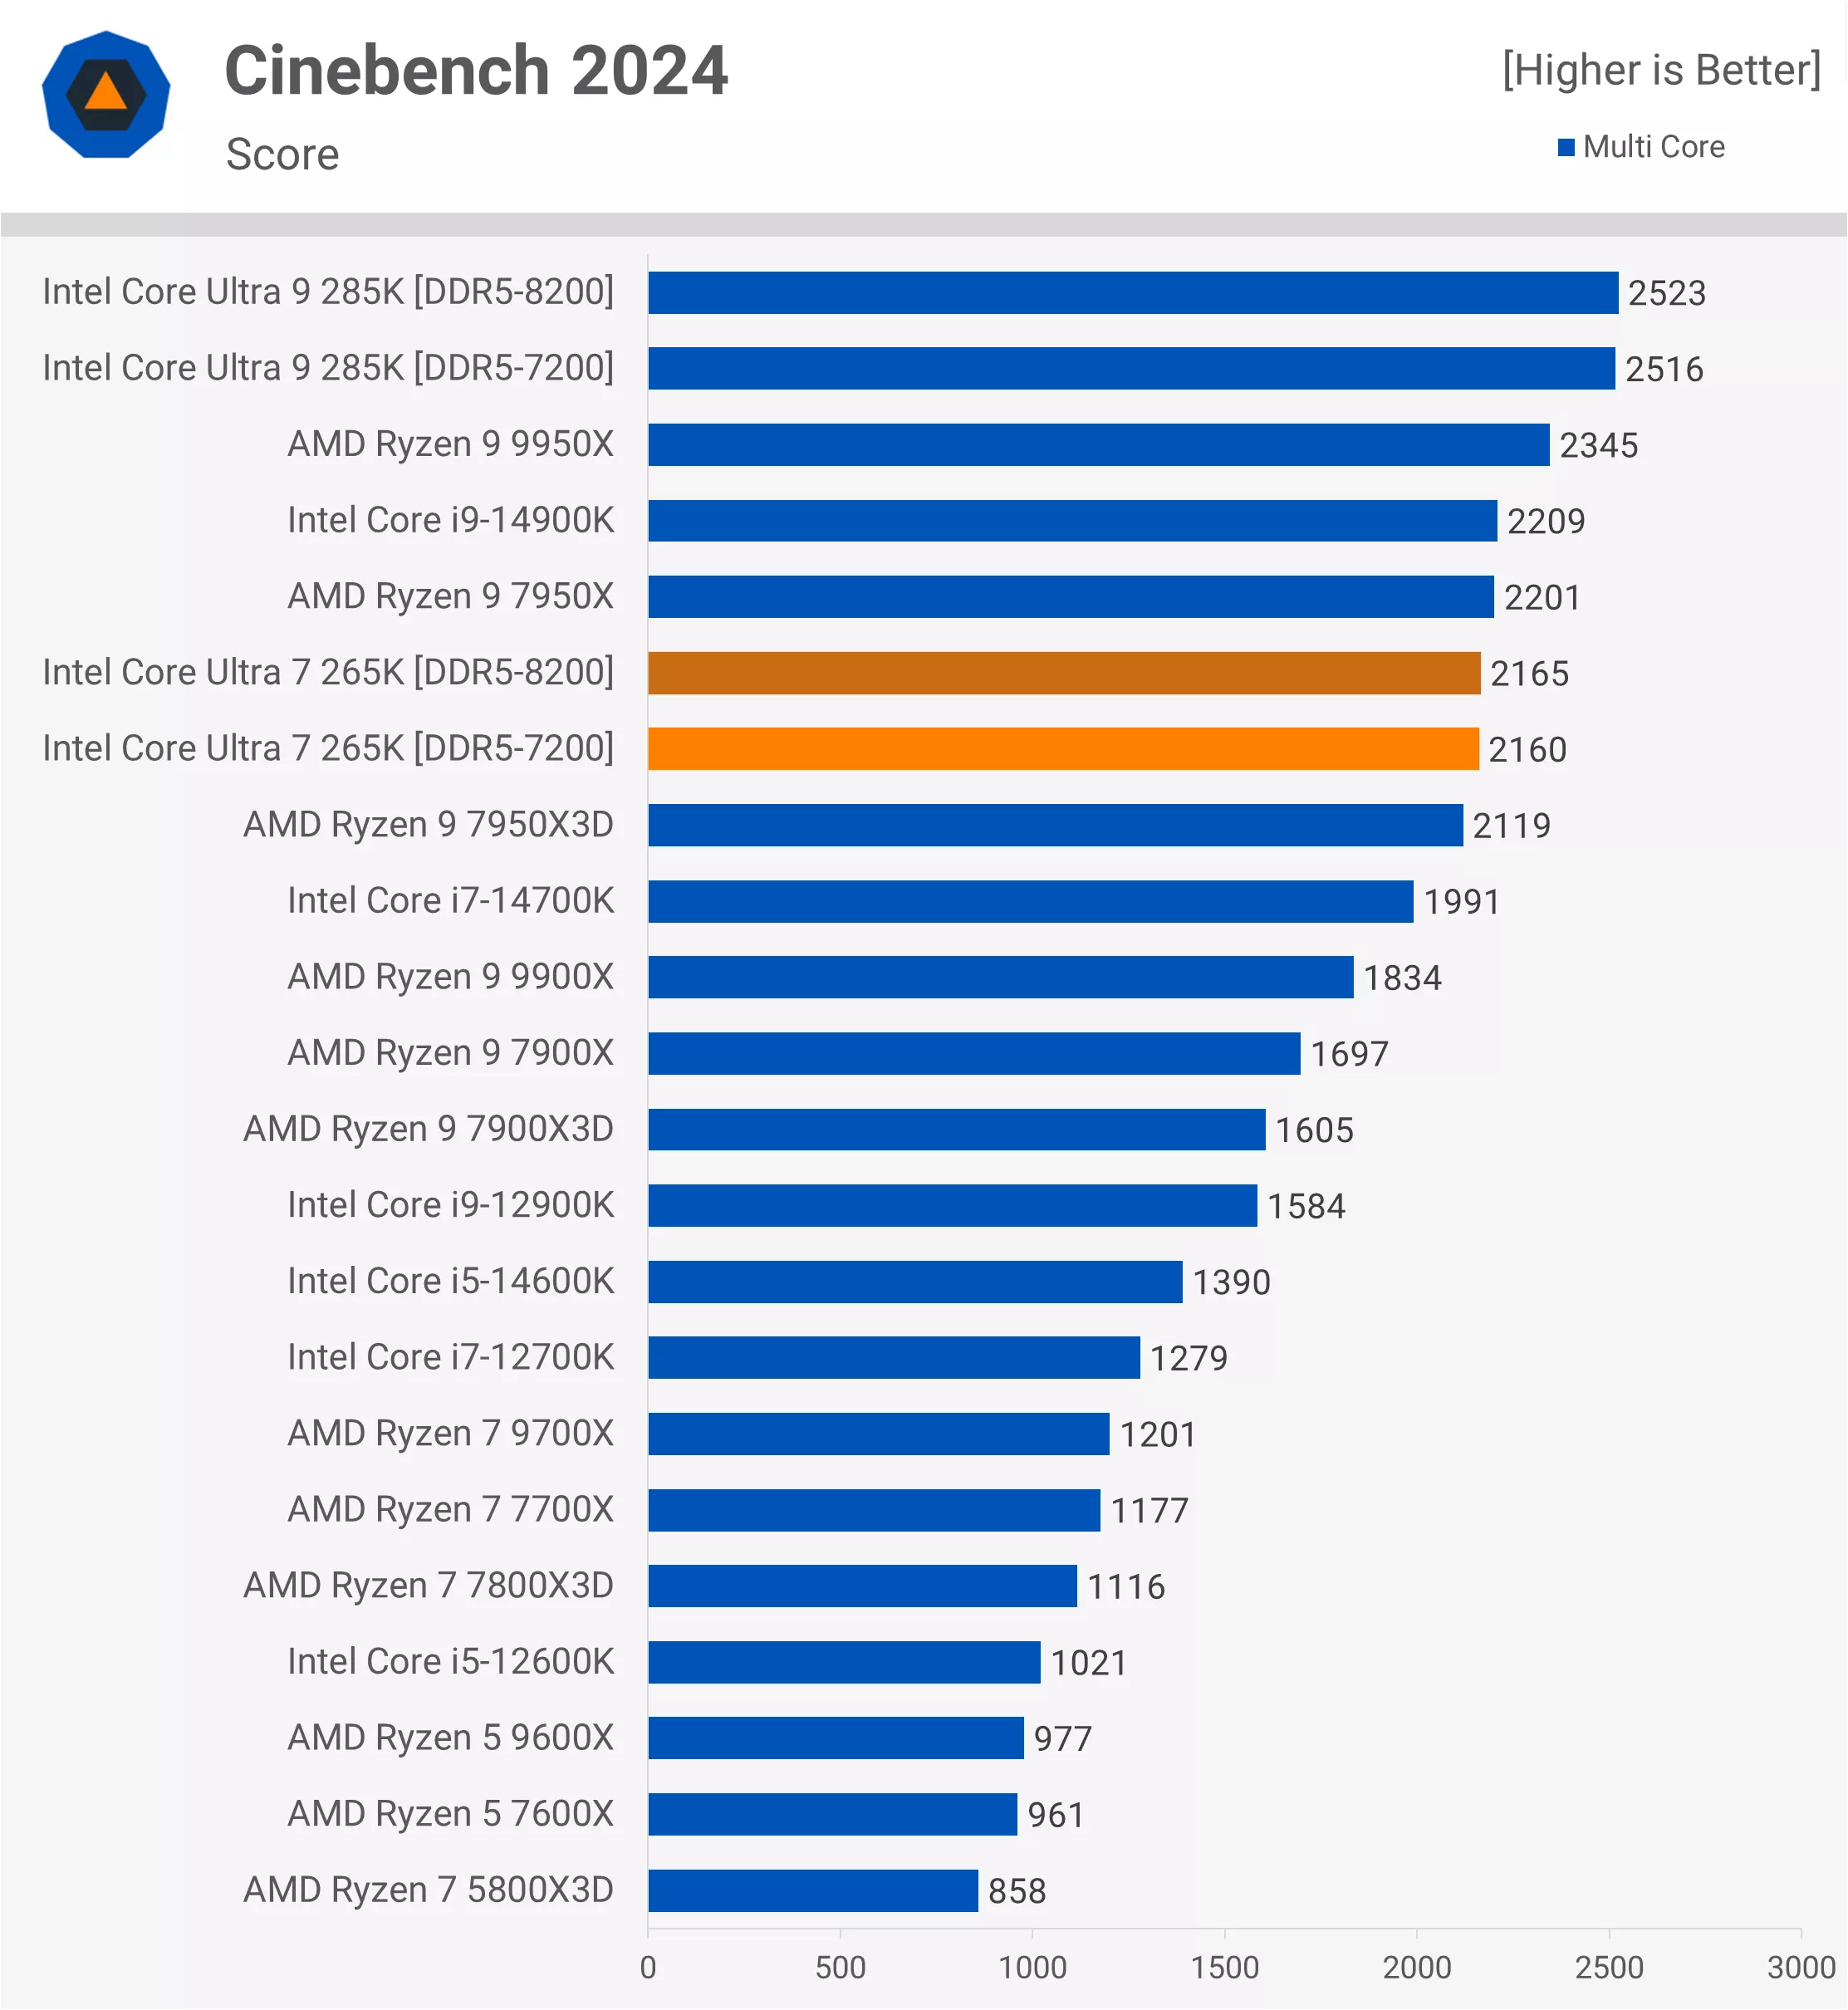
Now, turning to Cinebench multi-core performance, we see the 265K reaching just shy of 2,200 points, making it 8% faster than the 14700K and 18% faster than the 9900X. This places its performance on par with the 7950X and 14900K in this test.
Cinebench 2024, Single-Core
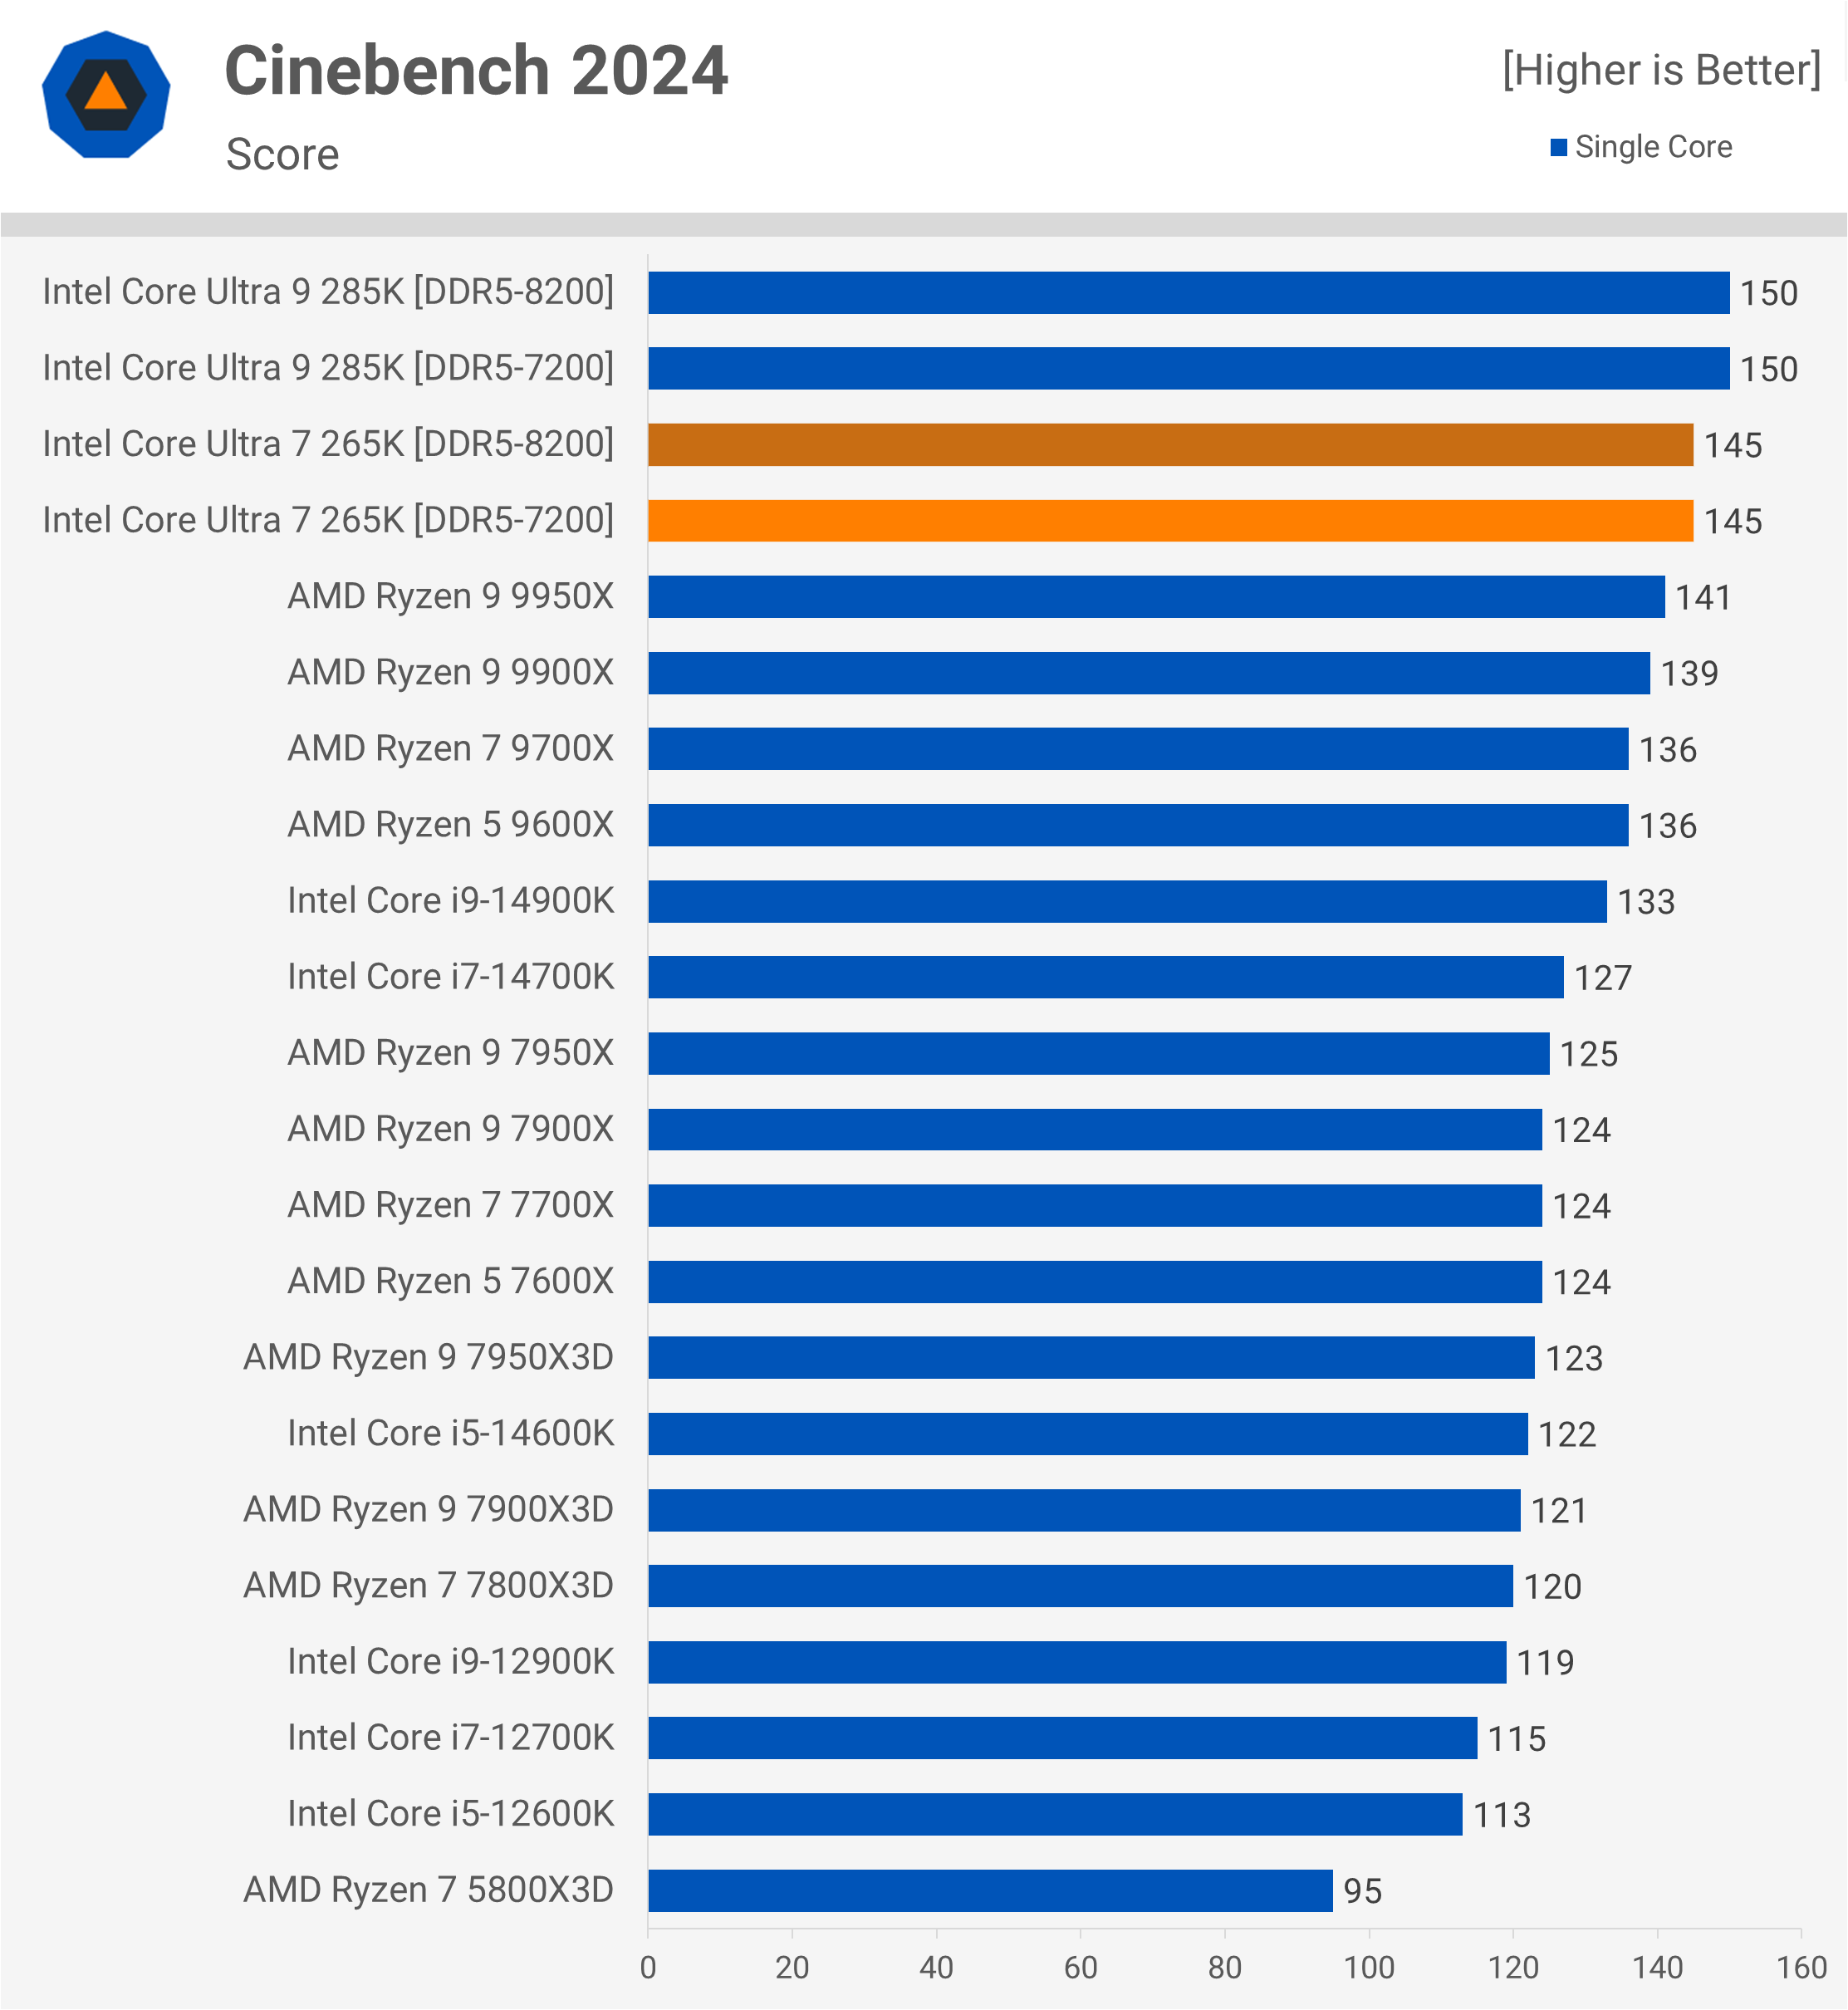
Single-core performance is also strong, with the P-Cores achieving 145 points – 4% higher than the 9900X and 14% faster than the 14700K.
Cinebench 2024 Power Consumption
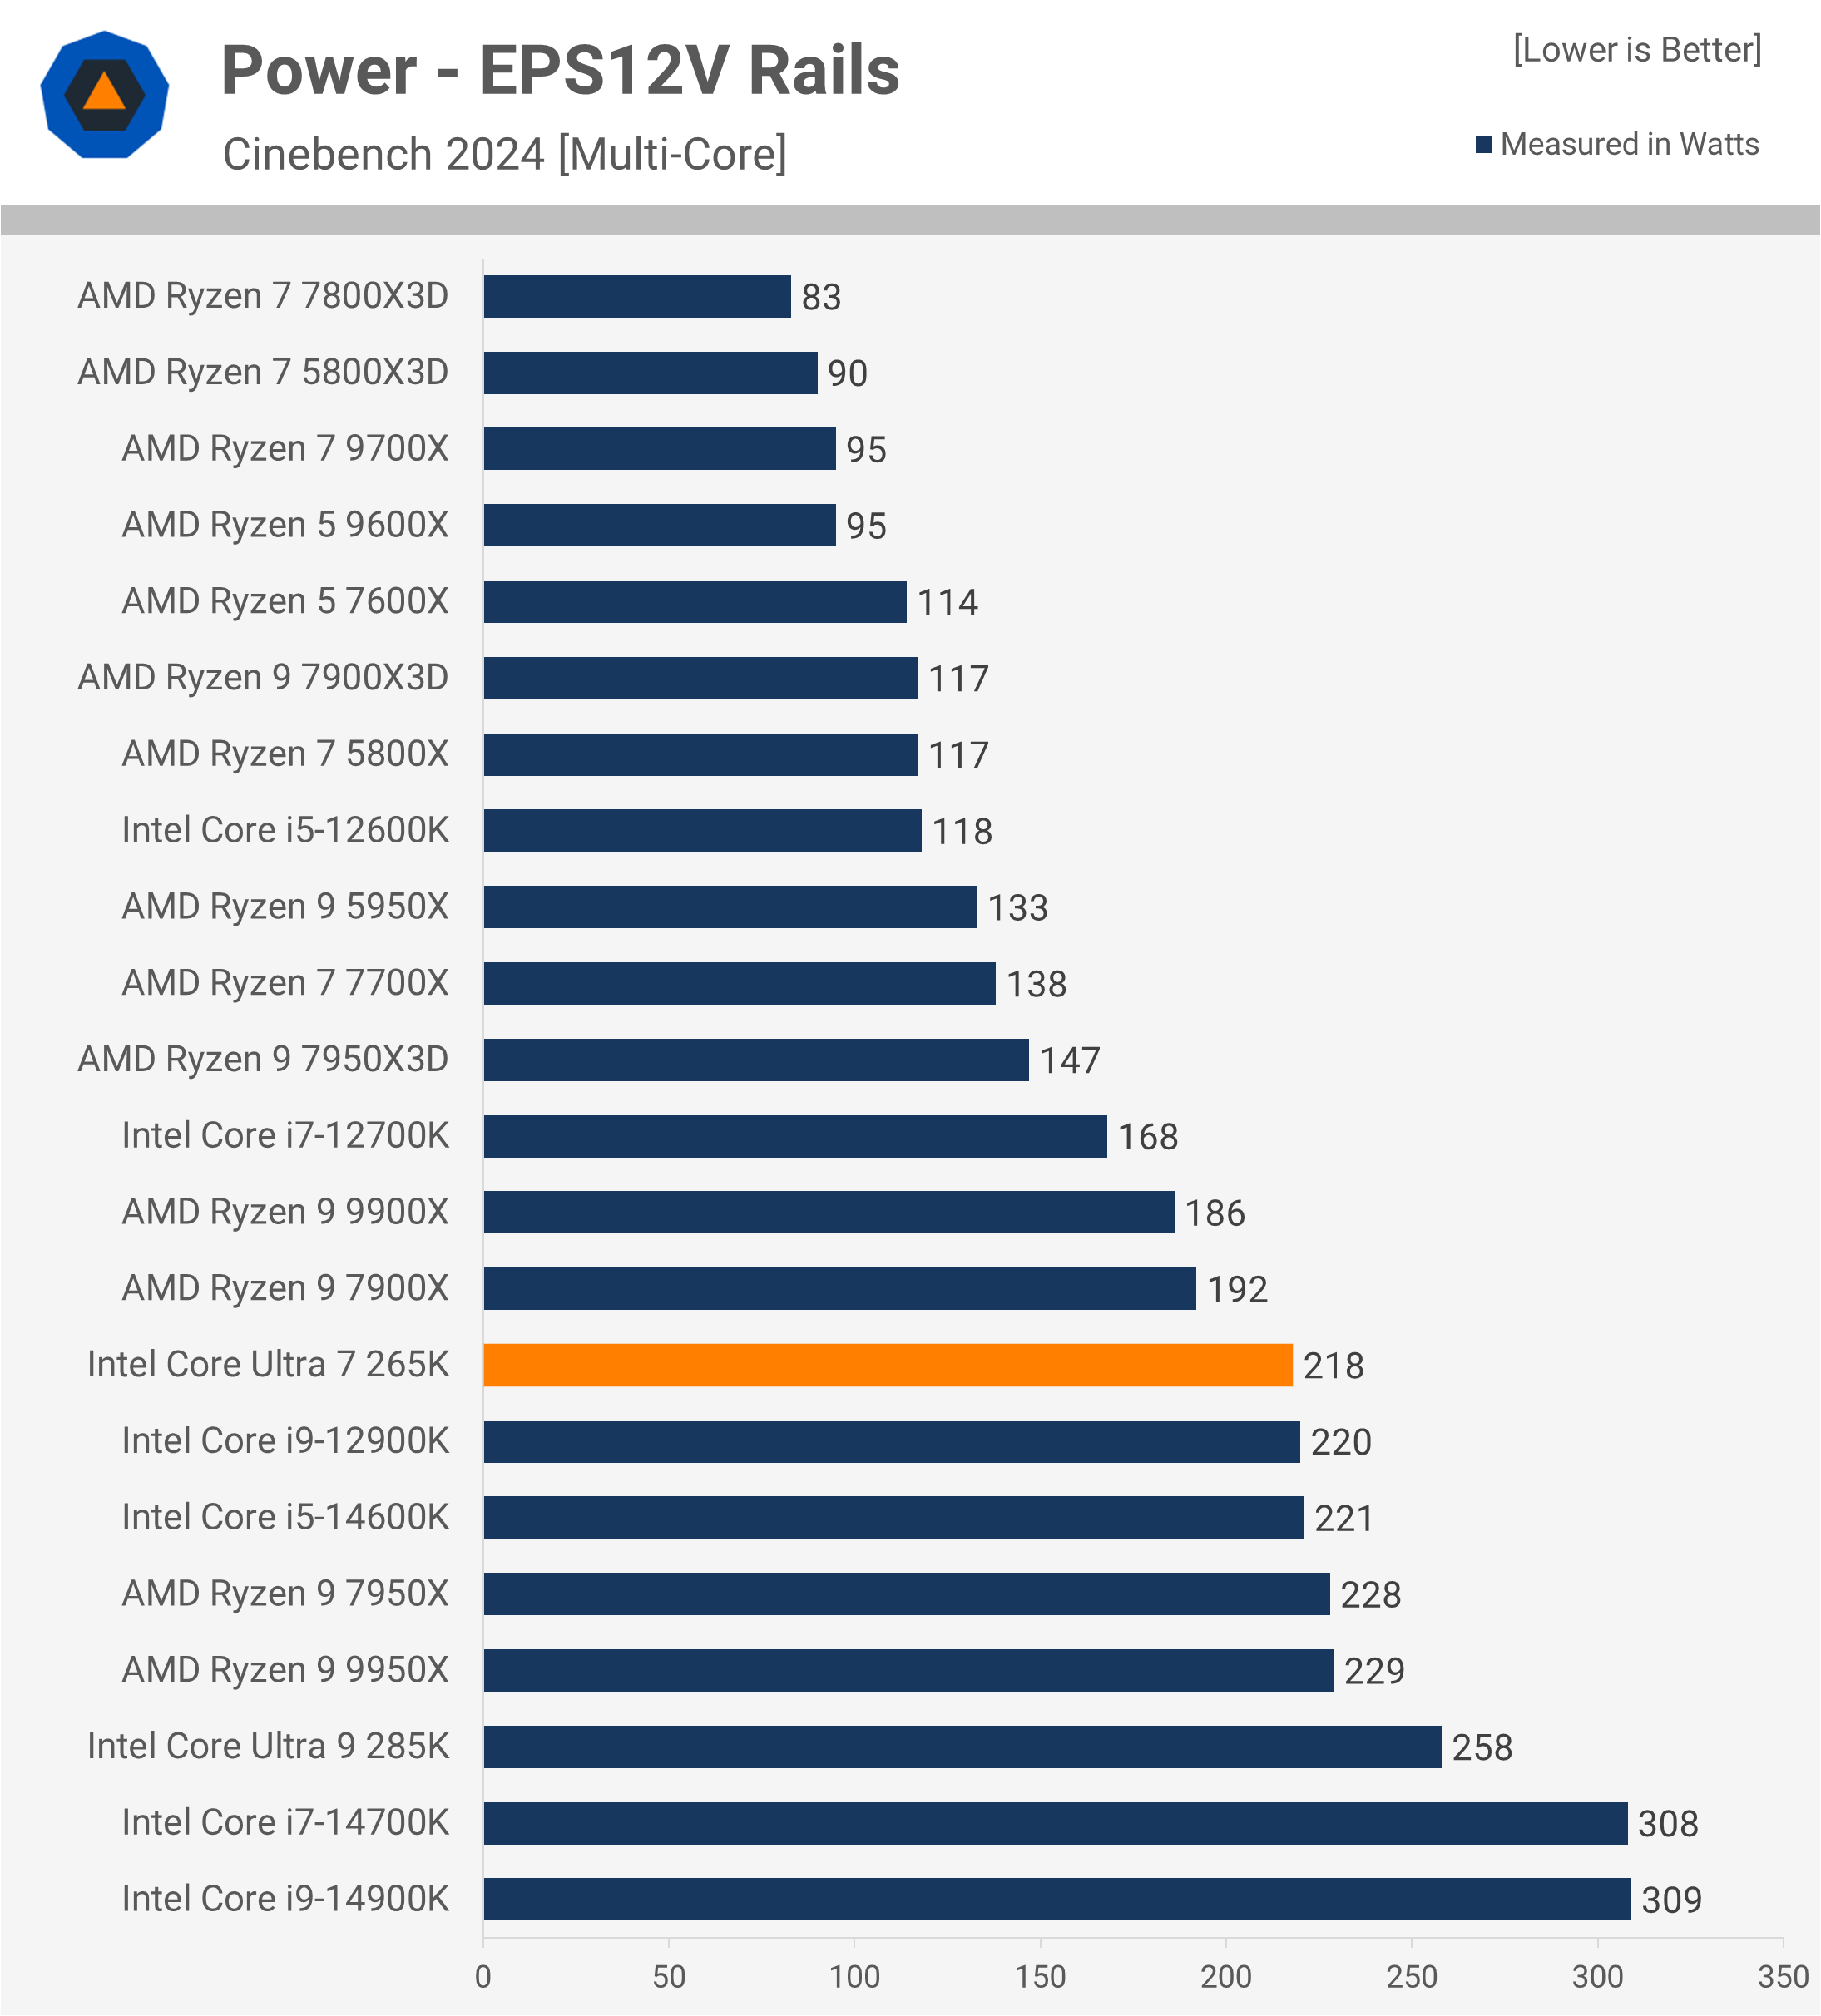
Regarding power consumption, the 265K draws 218W, which is comparable to the power usage of the 12900K, 14600K, 7950X, and 9950X. As we just saw, its performance aligns closely with the 7950X, indicating a similar level of power efficiency in this workload.
The 265K is also 8% faster than the 14700K while achieving nearly 100W in power savings – an impressive 29% reduction. However, more efficient Ryzen processors, like the 7950X3D, deliver comparable performance to the 265K while consuming 33% less power.
7-Zip File Manager Compression
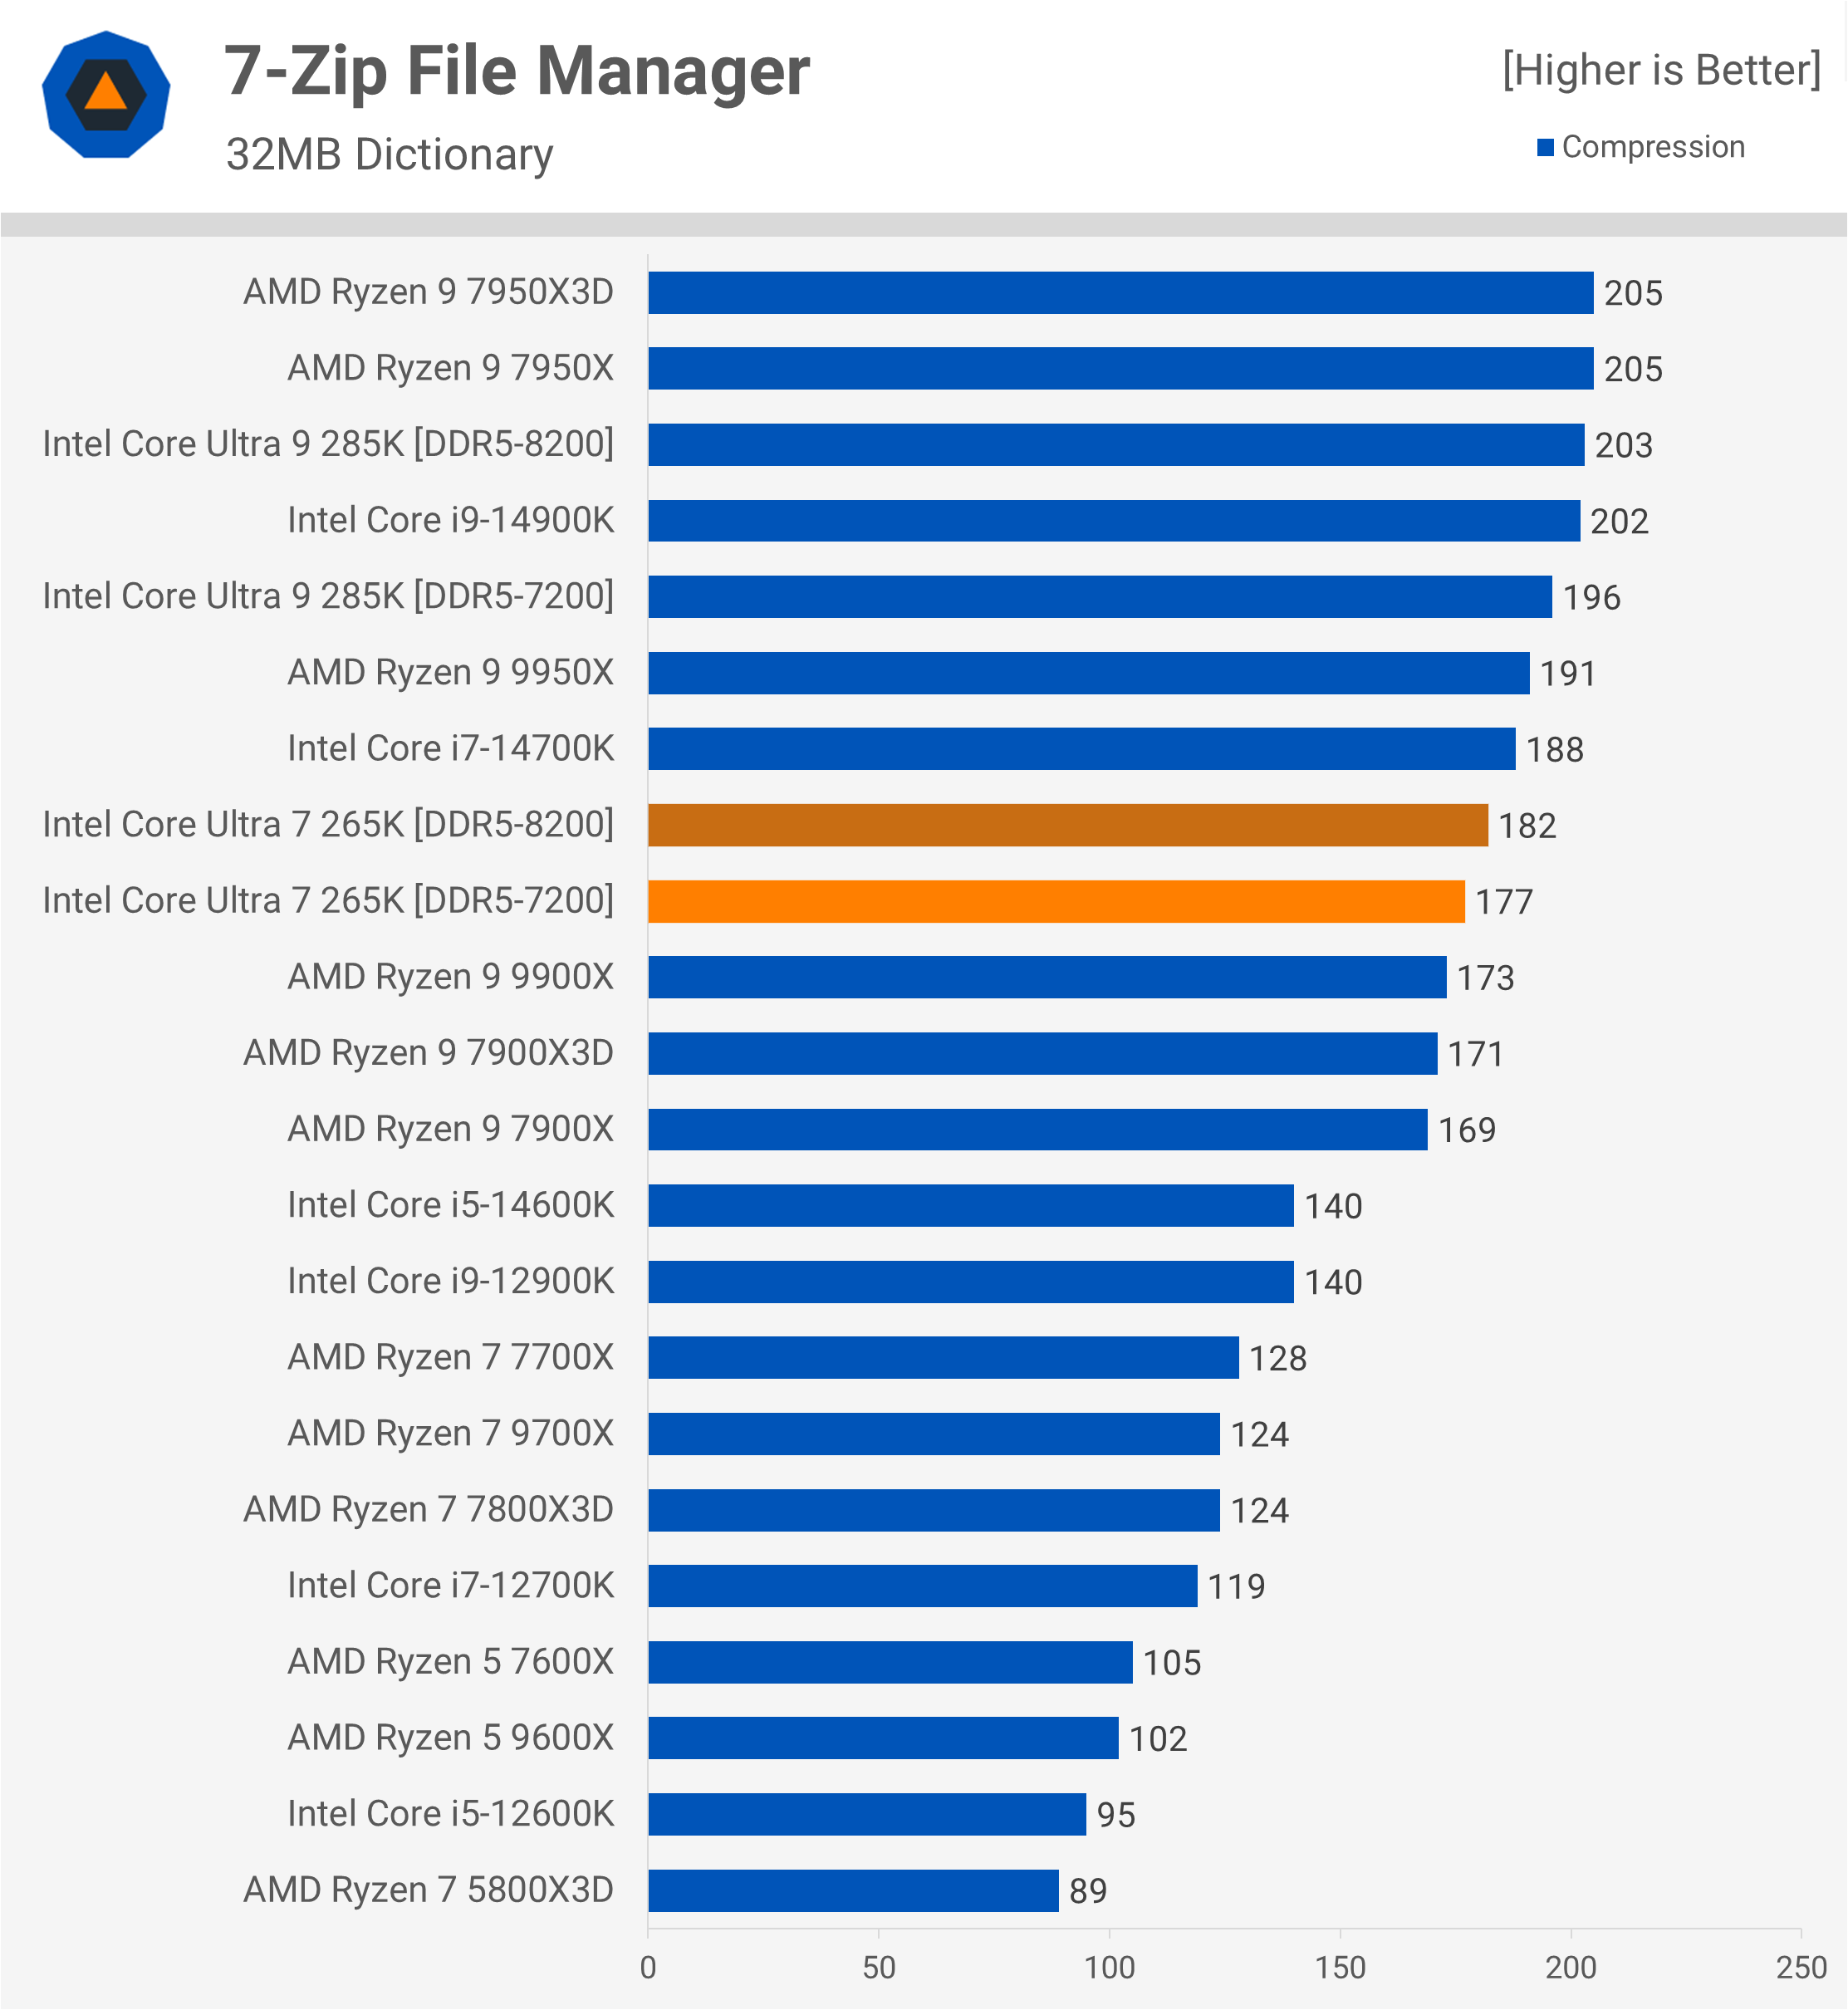
Moving on to file compression performance, we find the 265K slightly slower than the 14700K, trailing by 6% when using identical DDR5-7200 memory. Performance was also comparable to that of the 9900X.
7-Zip File Manager Decompression
The 265K falls further behind the 14700K in decompression performance, partly due to its lack of SMT support. Using the same 7200 memory, it is 15% slower than the 14700K and 18% slower than the 9900X, which is a fairly disappointing result.
Blender Open Data
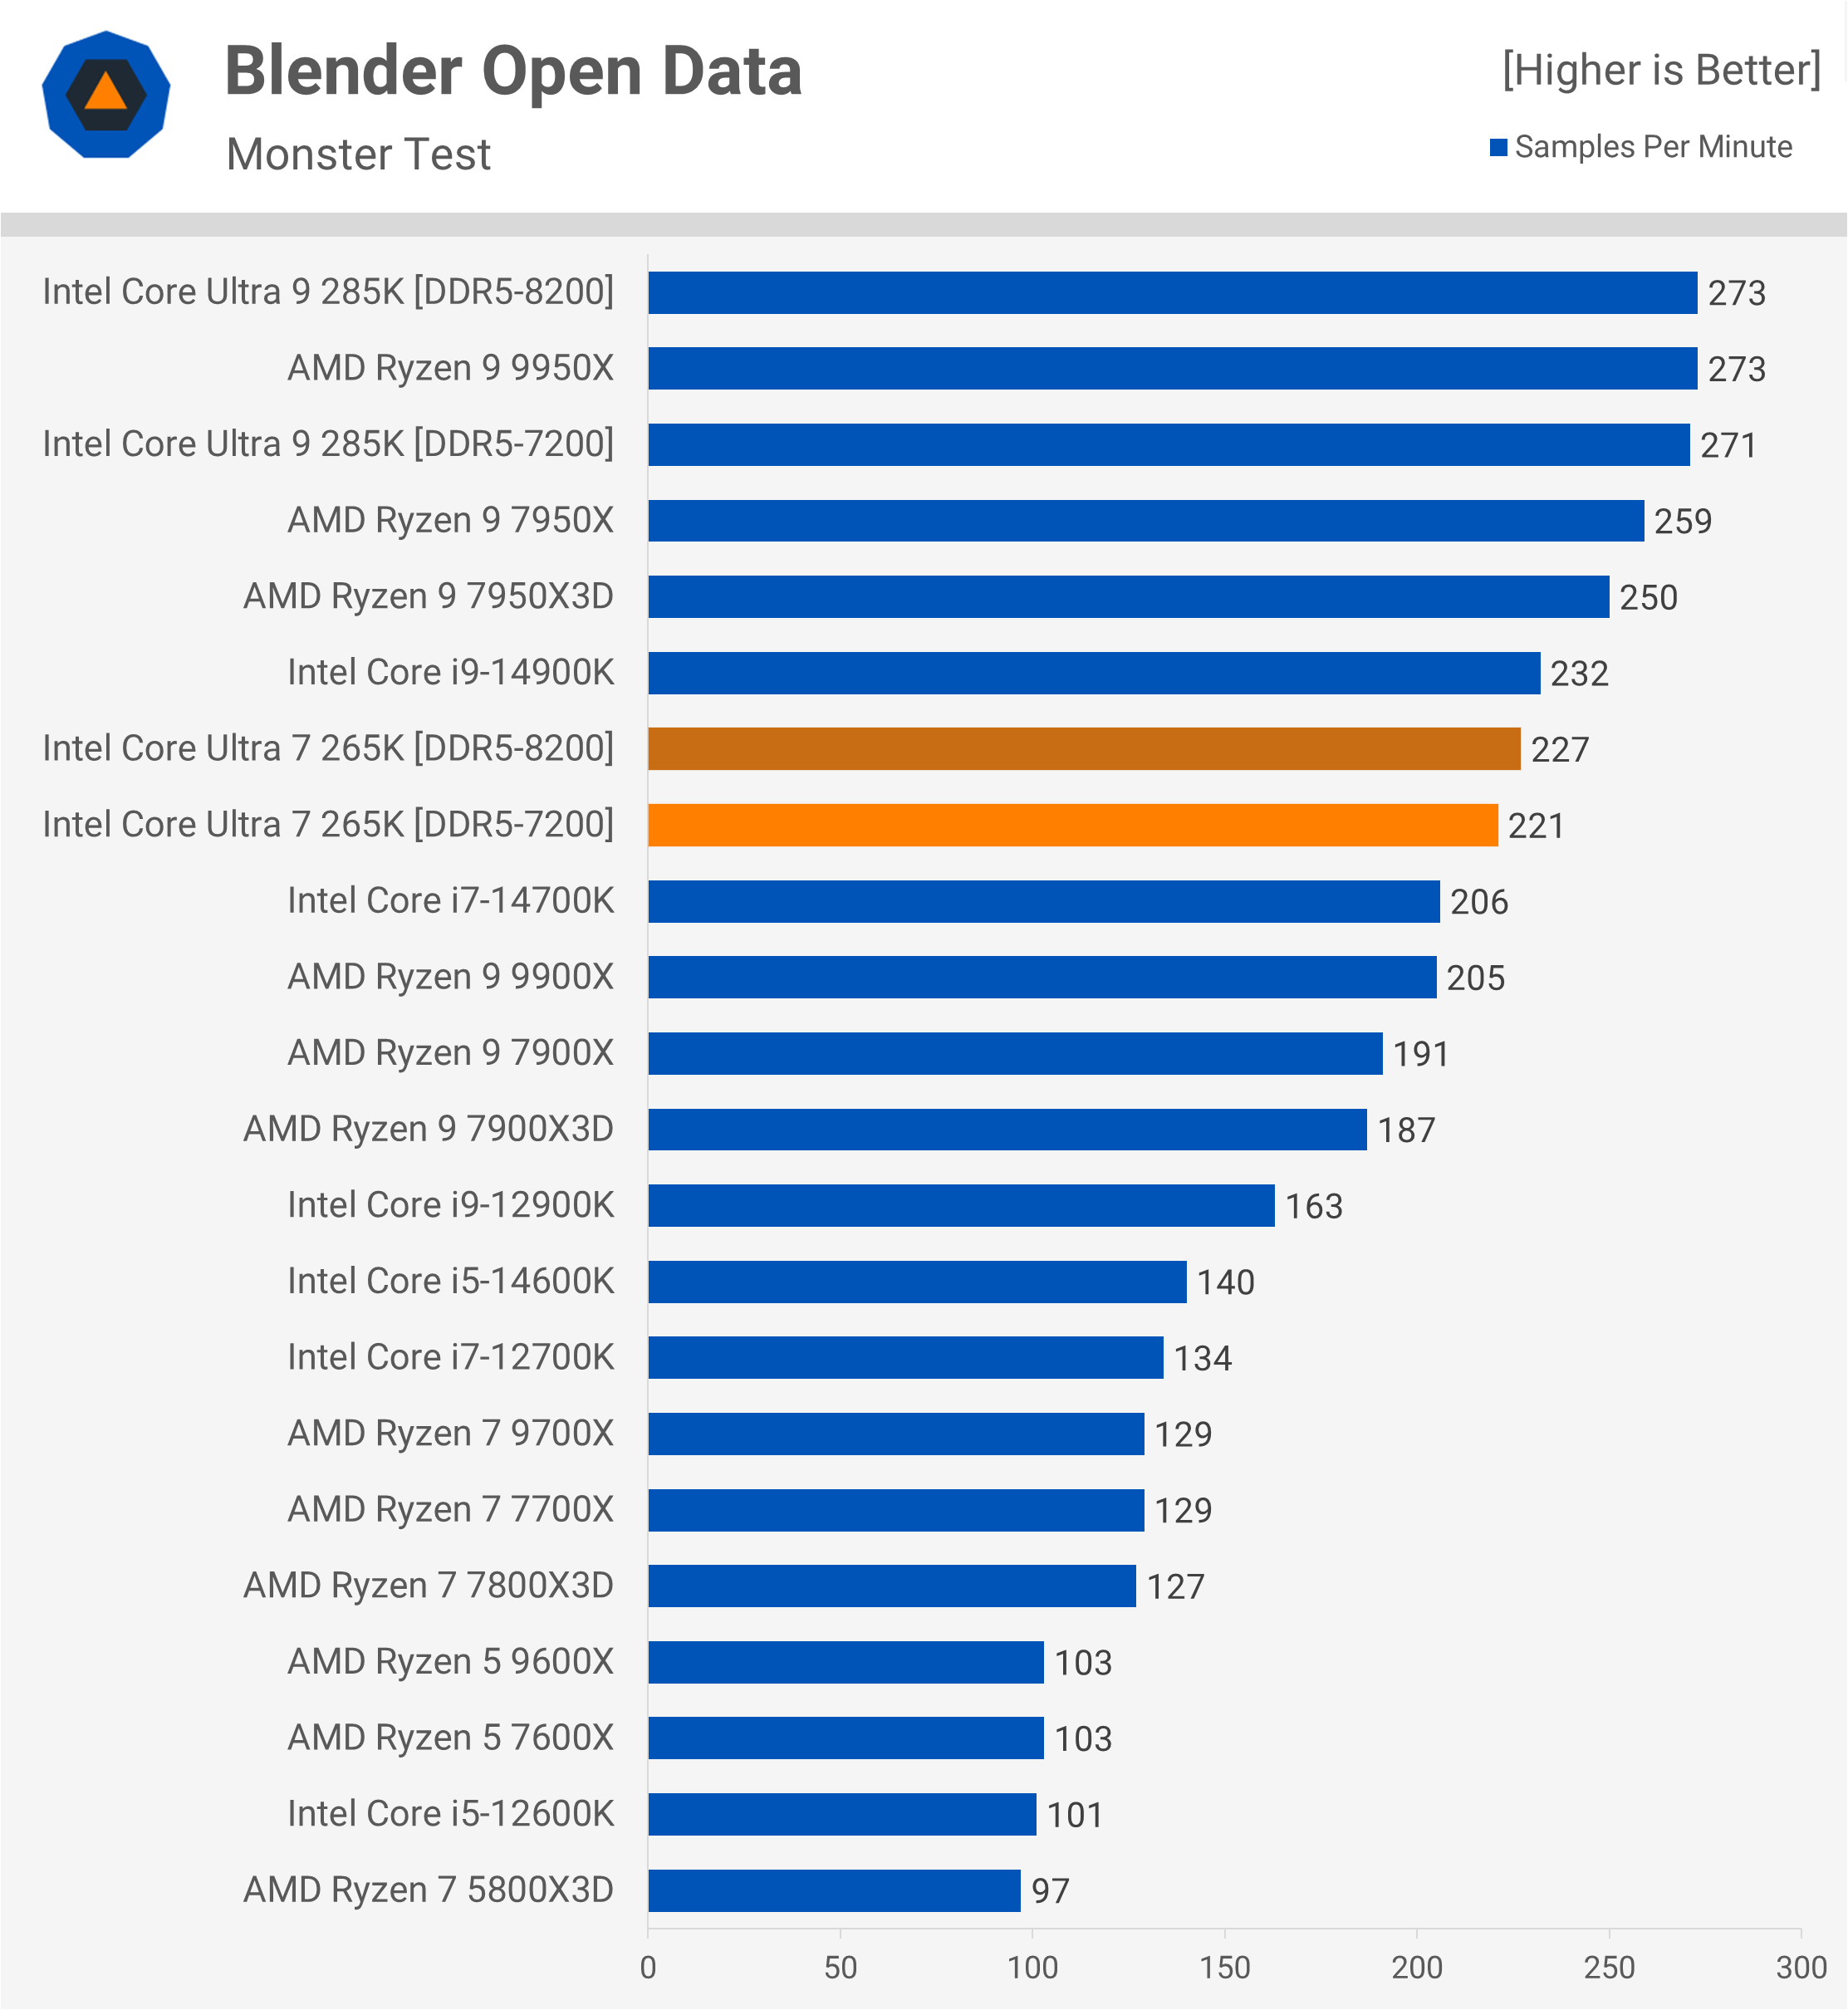
The Blender Open Data test yields more favorable results, with the 265K performing 7% faster than the 14700K and 8% faster than the 9900X, delivering performance levels comparable to the 14900K. Given the power savings, this is a positive outcome.
Corona 10 Benchmark
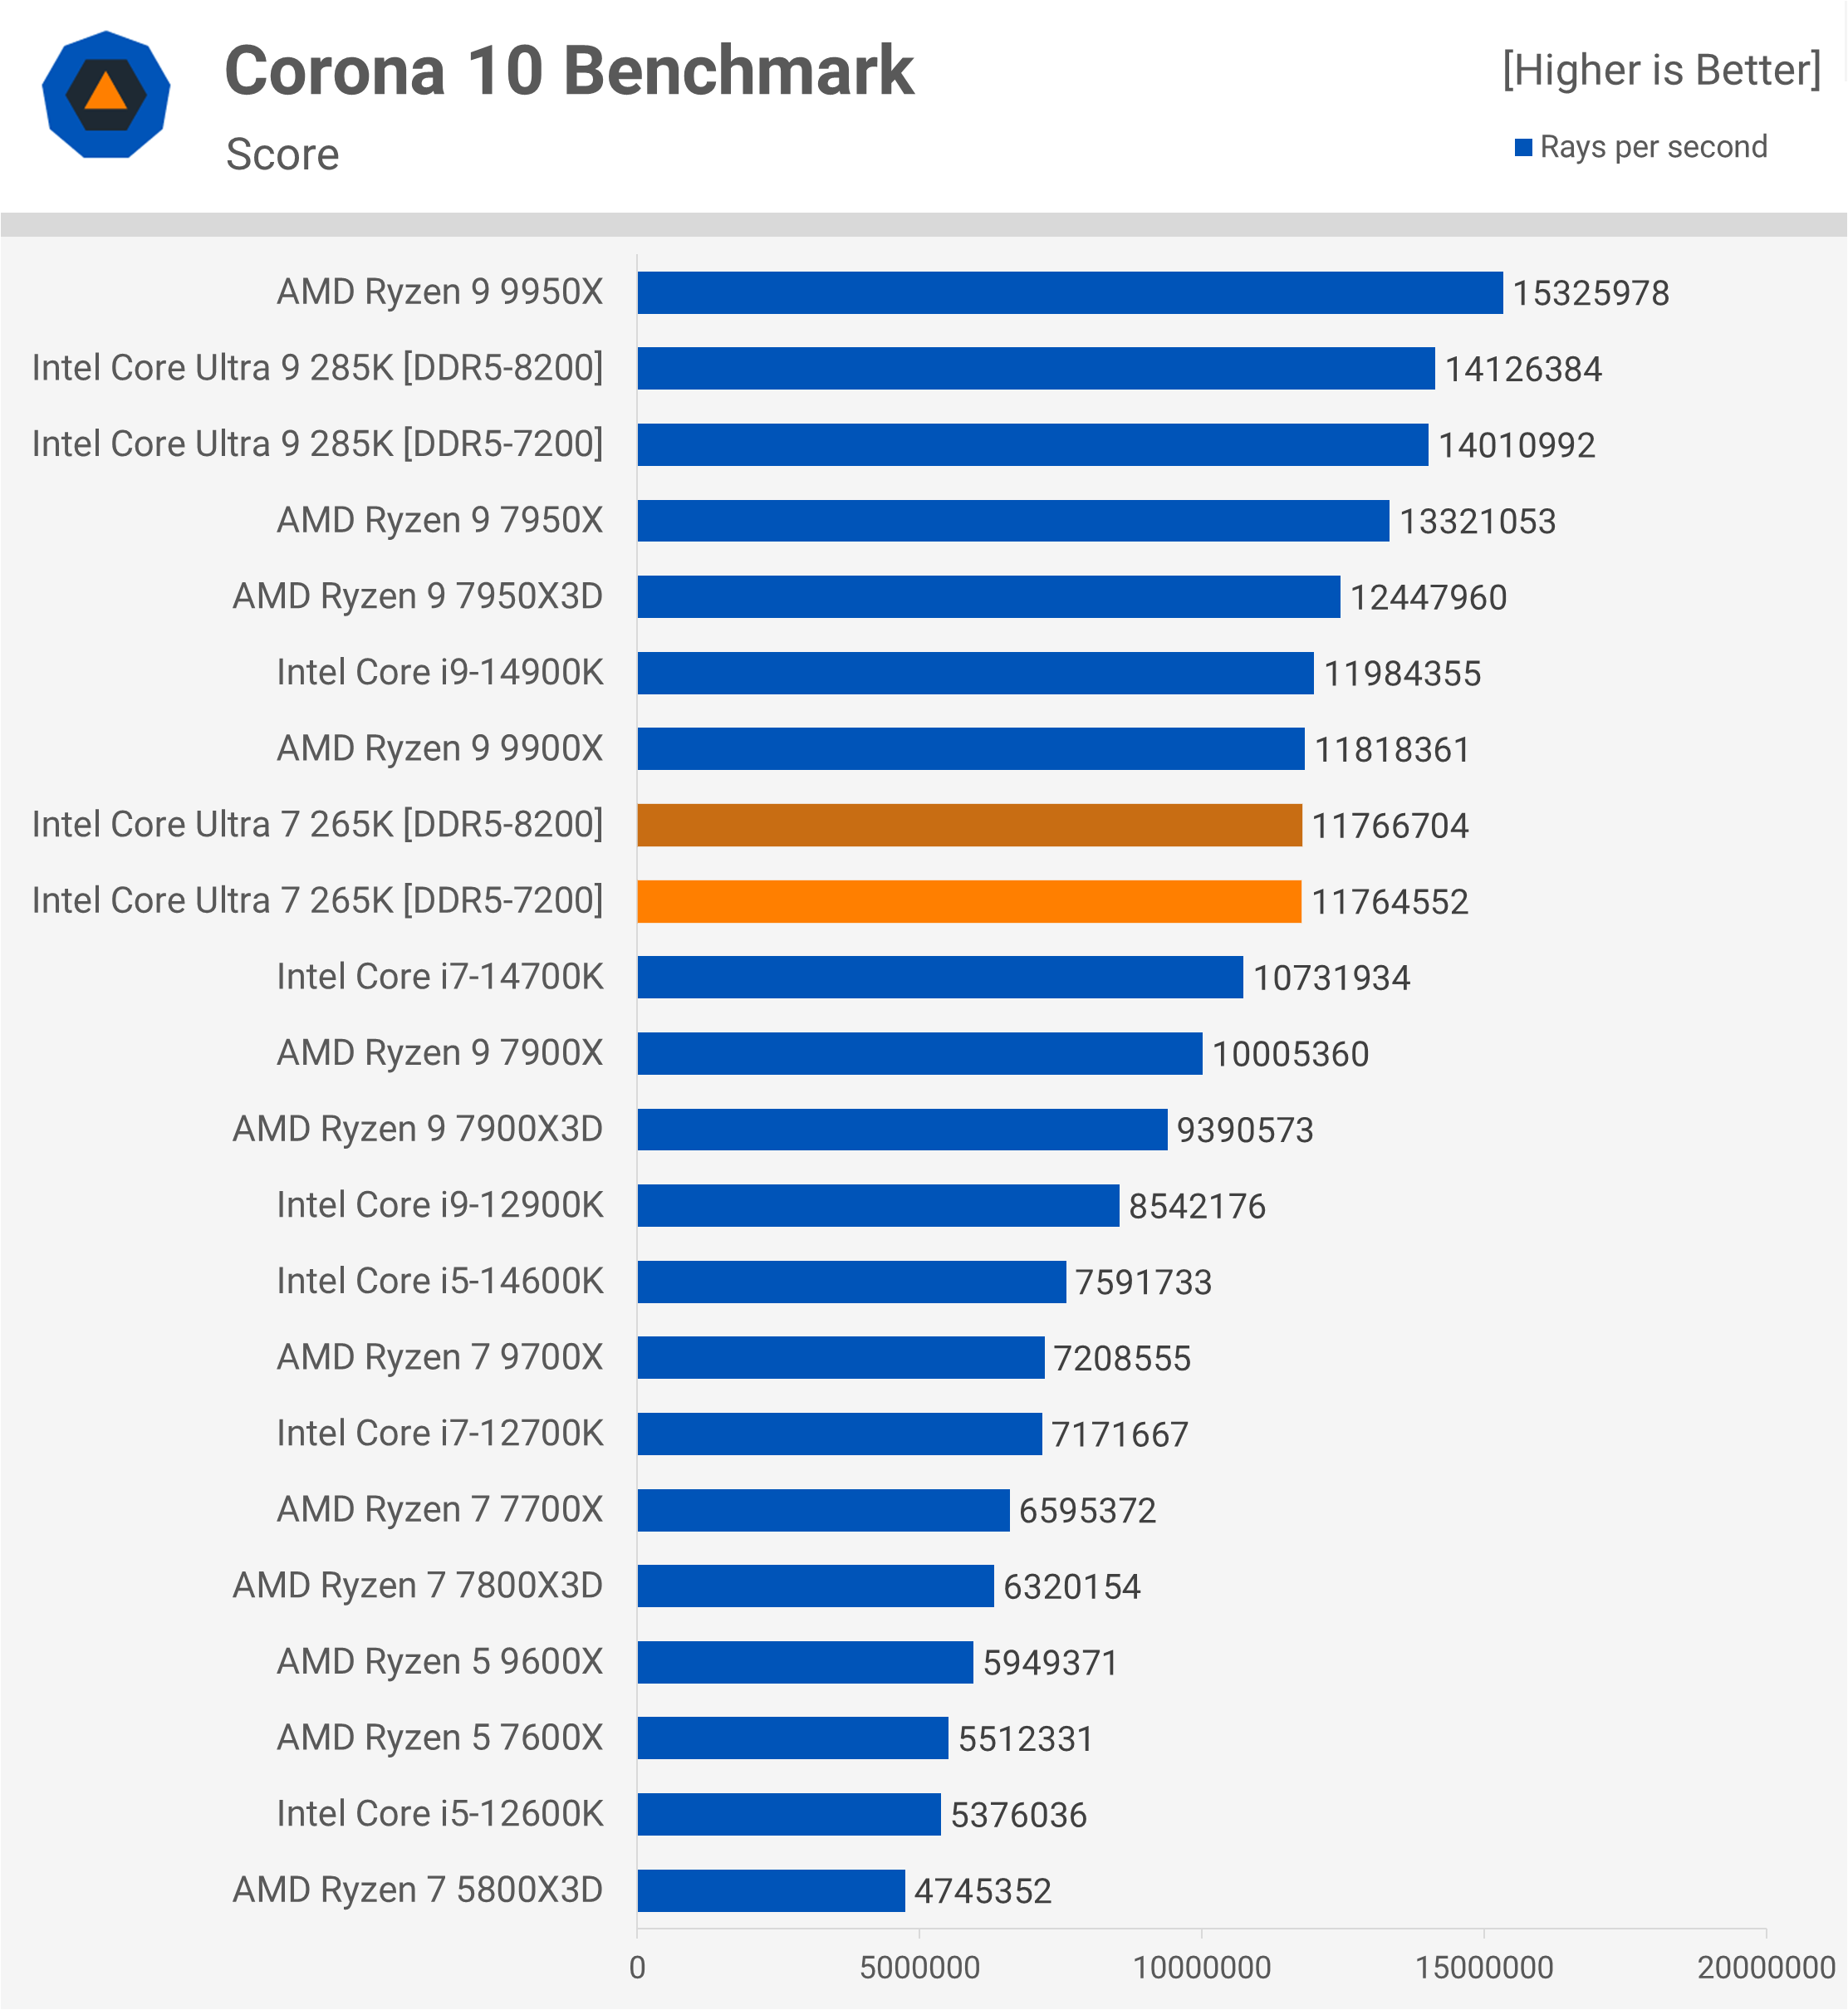
In the Corona 10 Benchmark, the 265K delivers performance akin to the 14900K and 9900X, making it 10% faster than the 14700K.
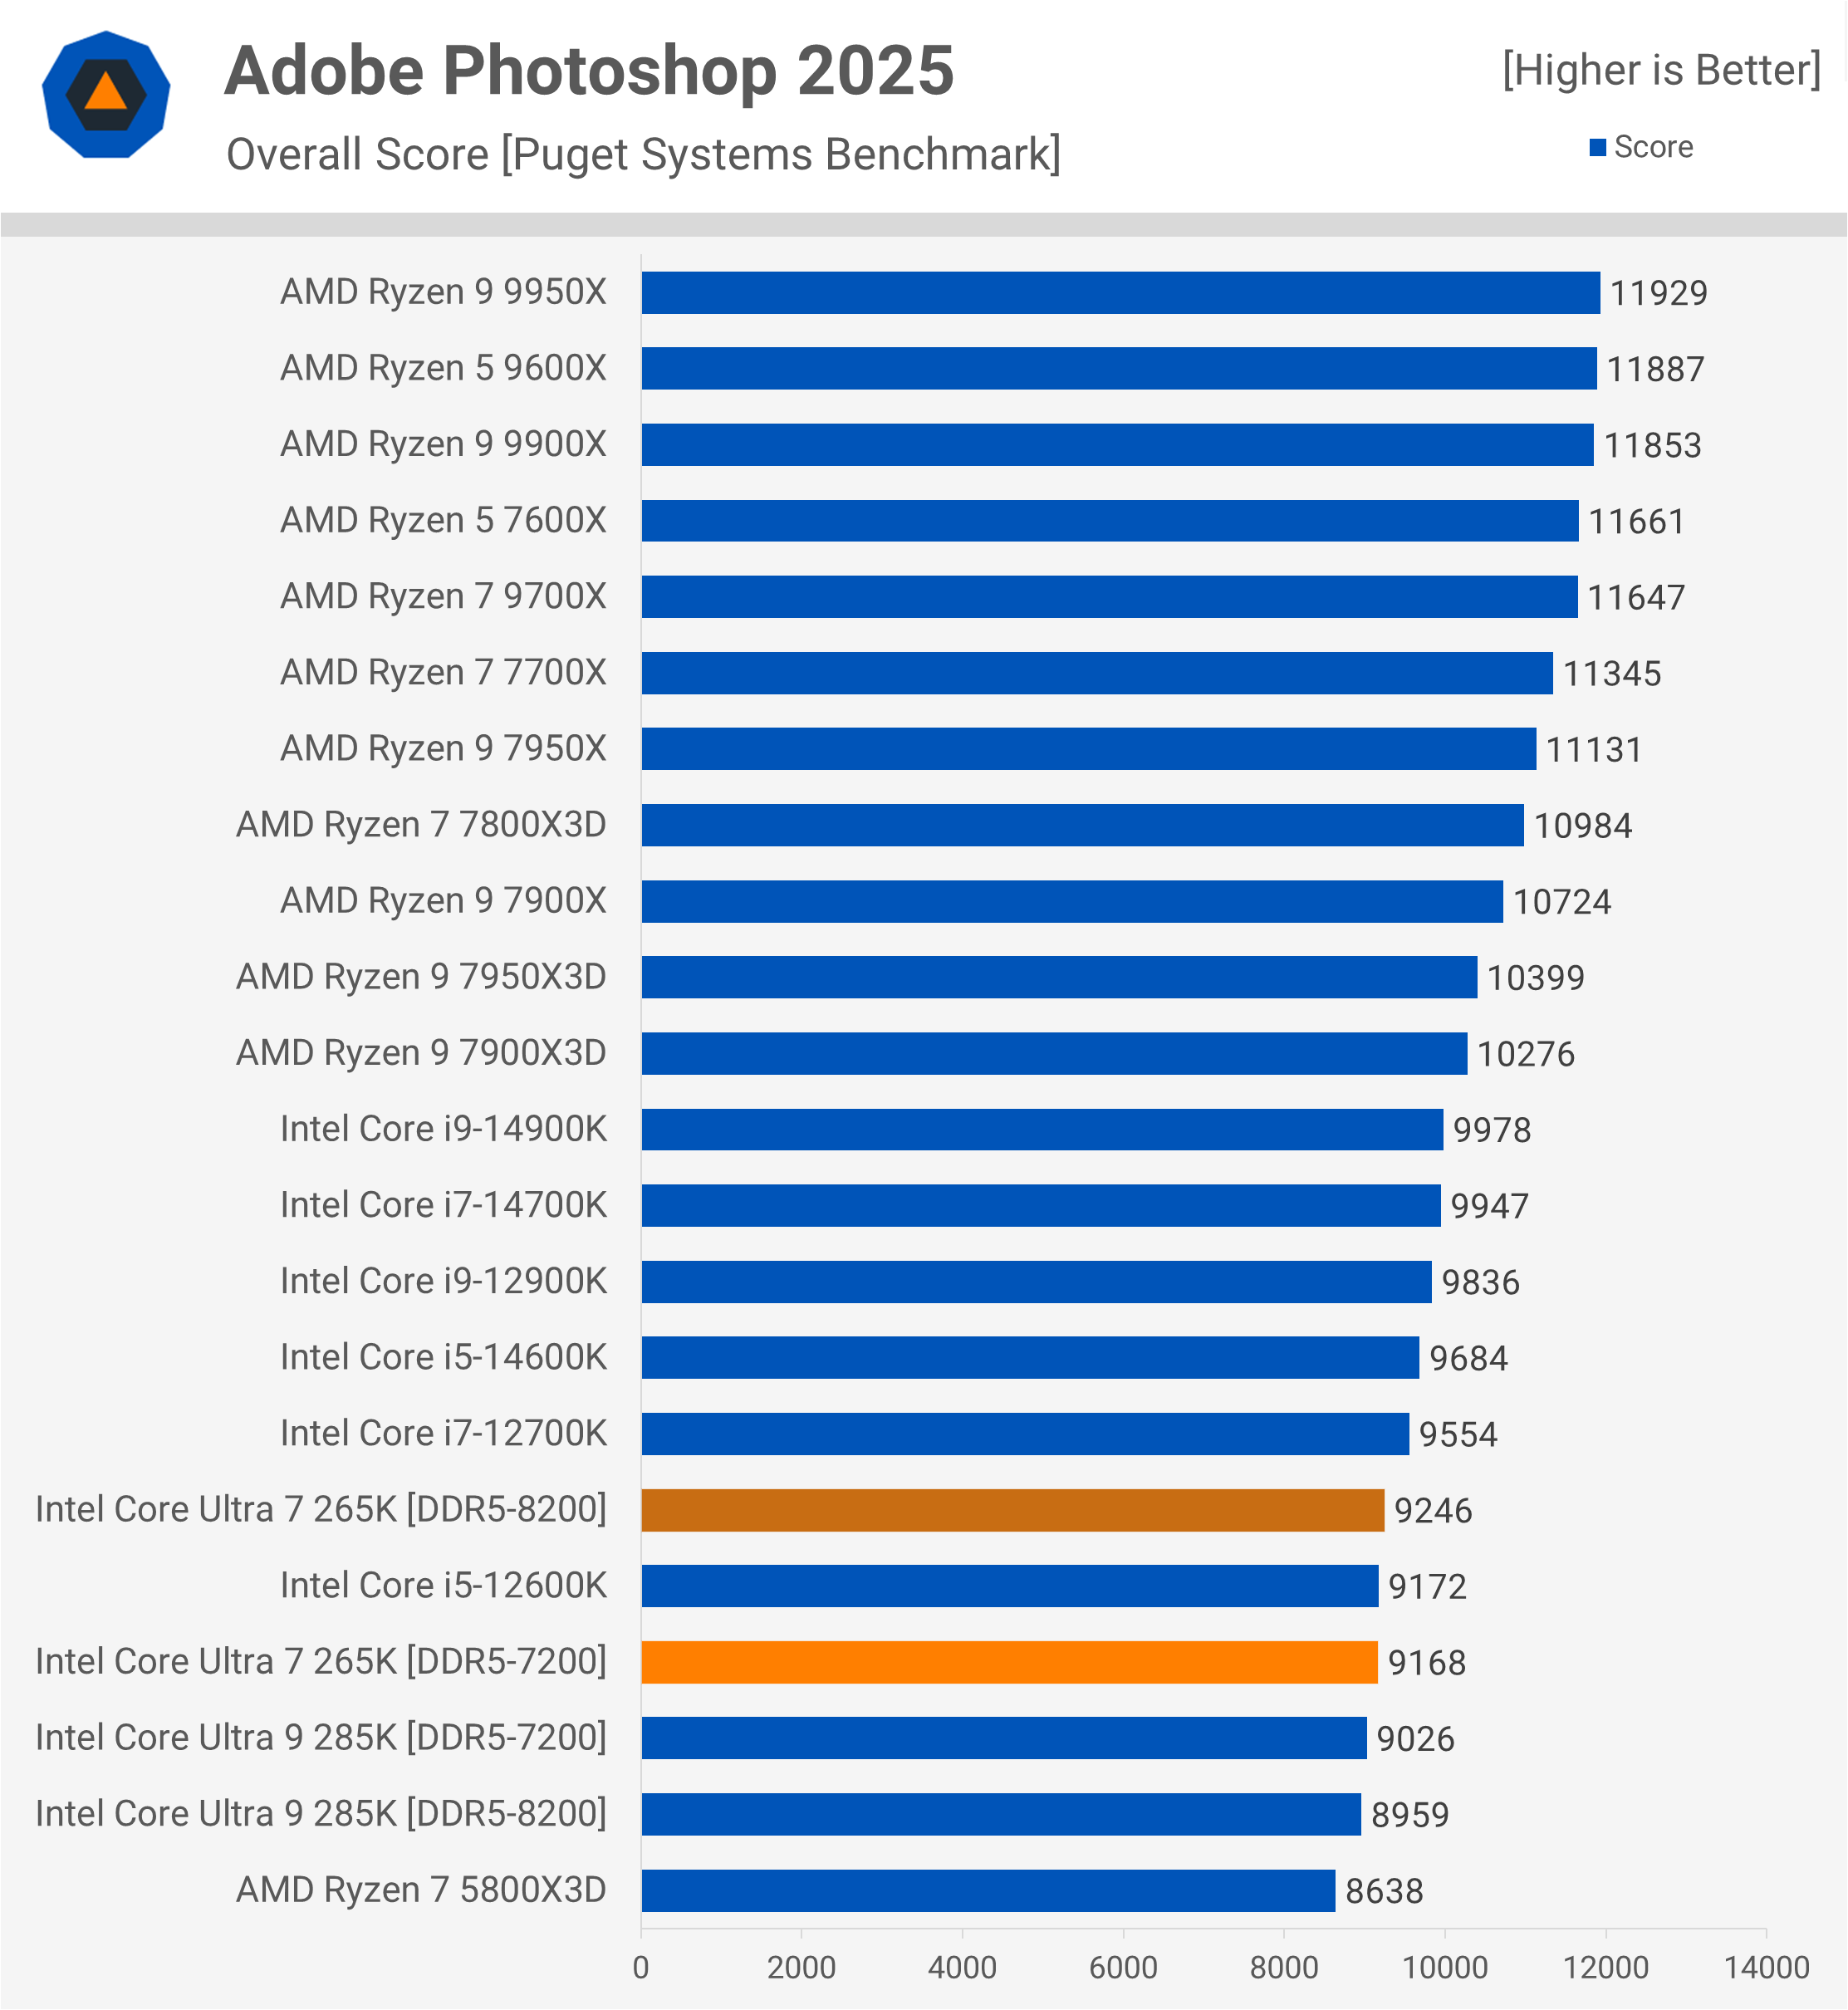
Adobe Photoshop 2025
Next, we have Photoshop 2025, where the new Arrow Lake CPUs perform below expectations. We are still analyzing this data, as these CPUs should generally excel in this workload. However, with our current configuration, the 265K only matches the Core i5-12600K, which is disappointing.
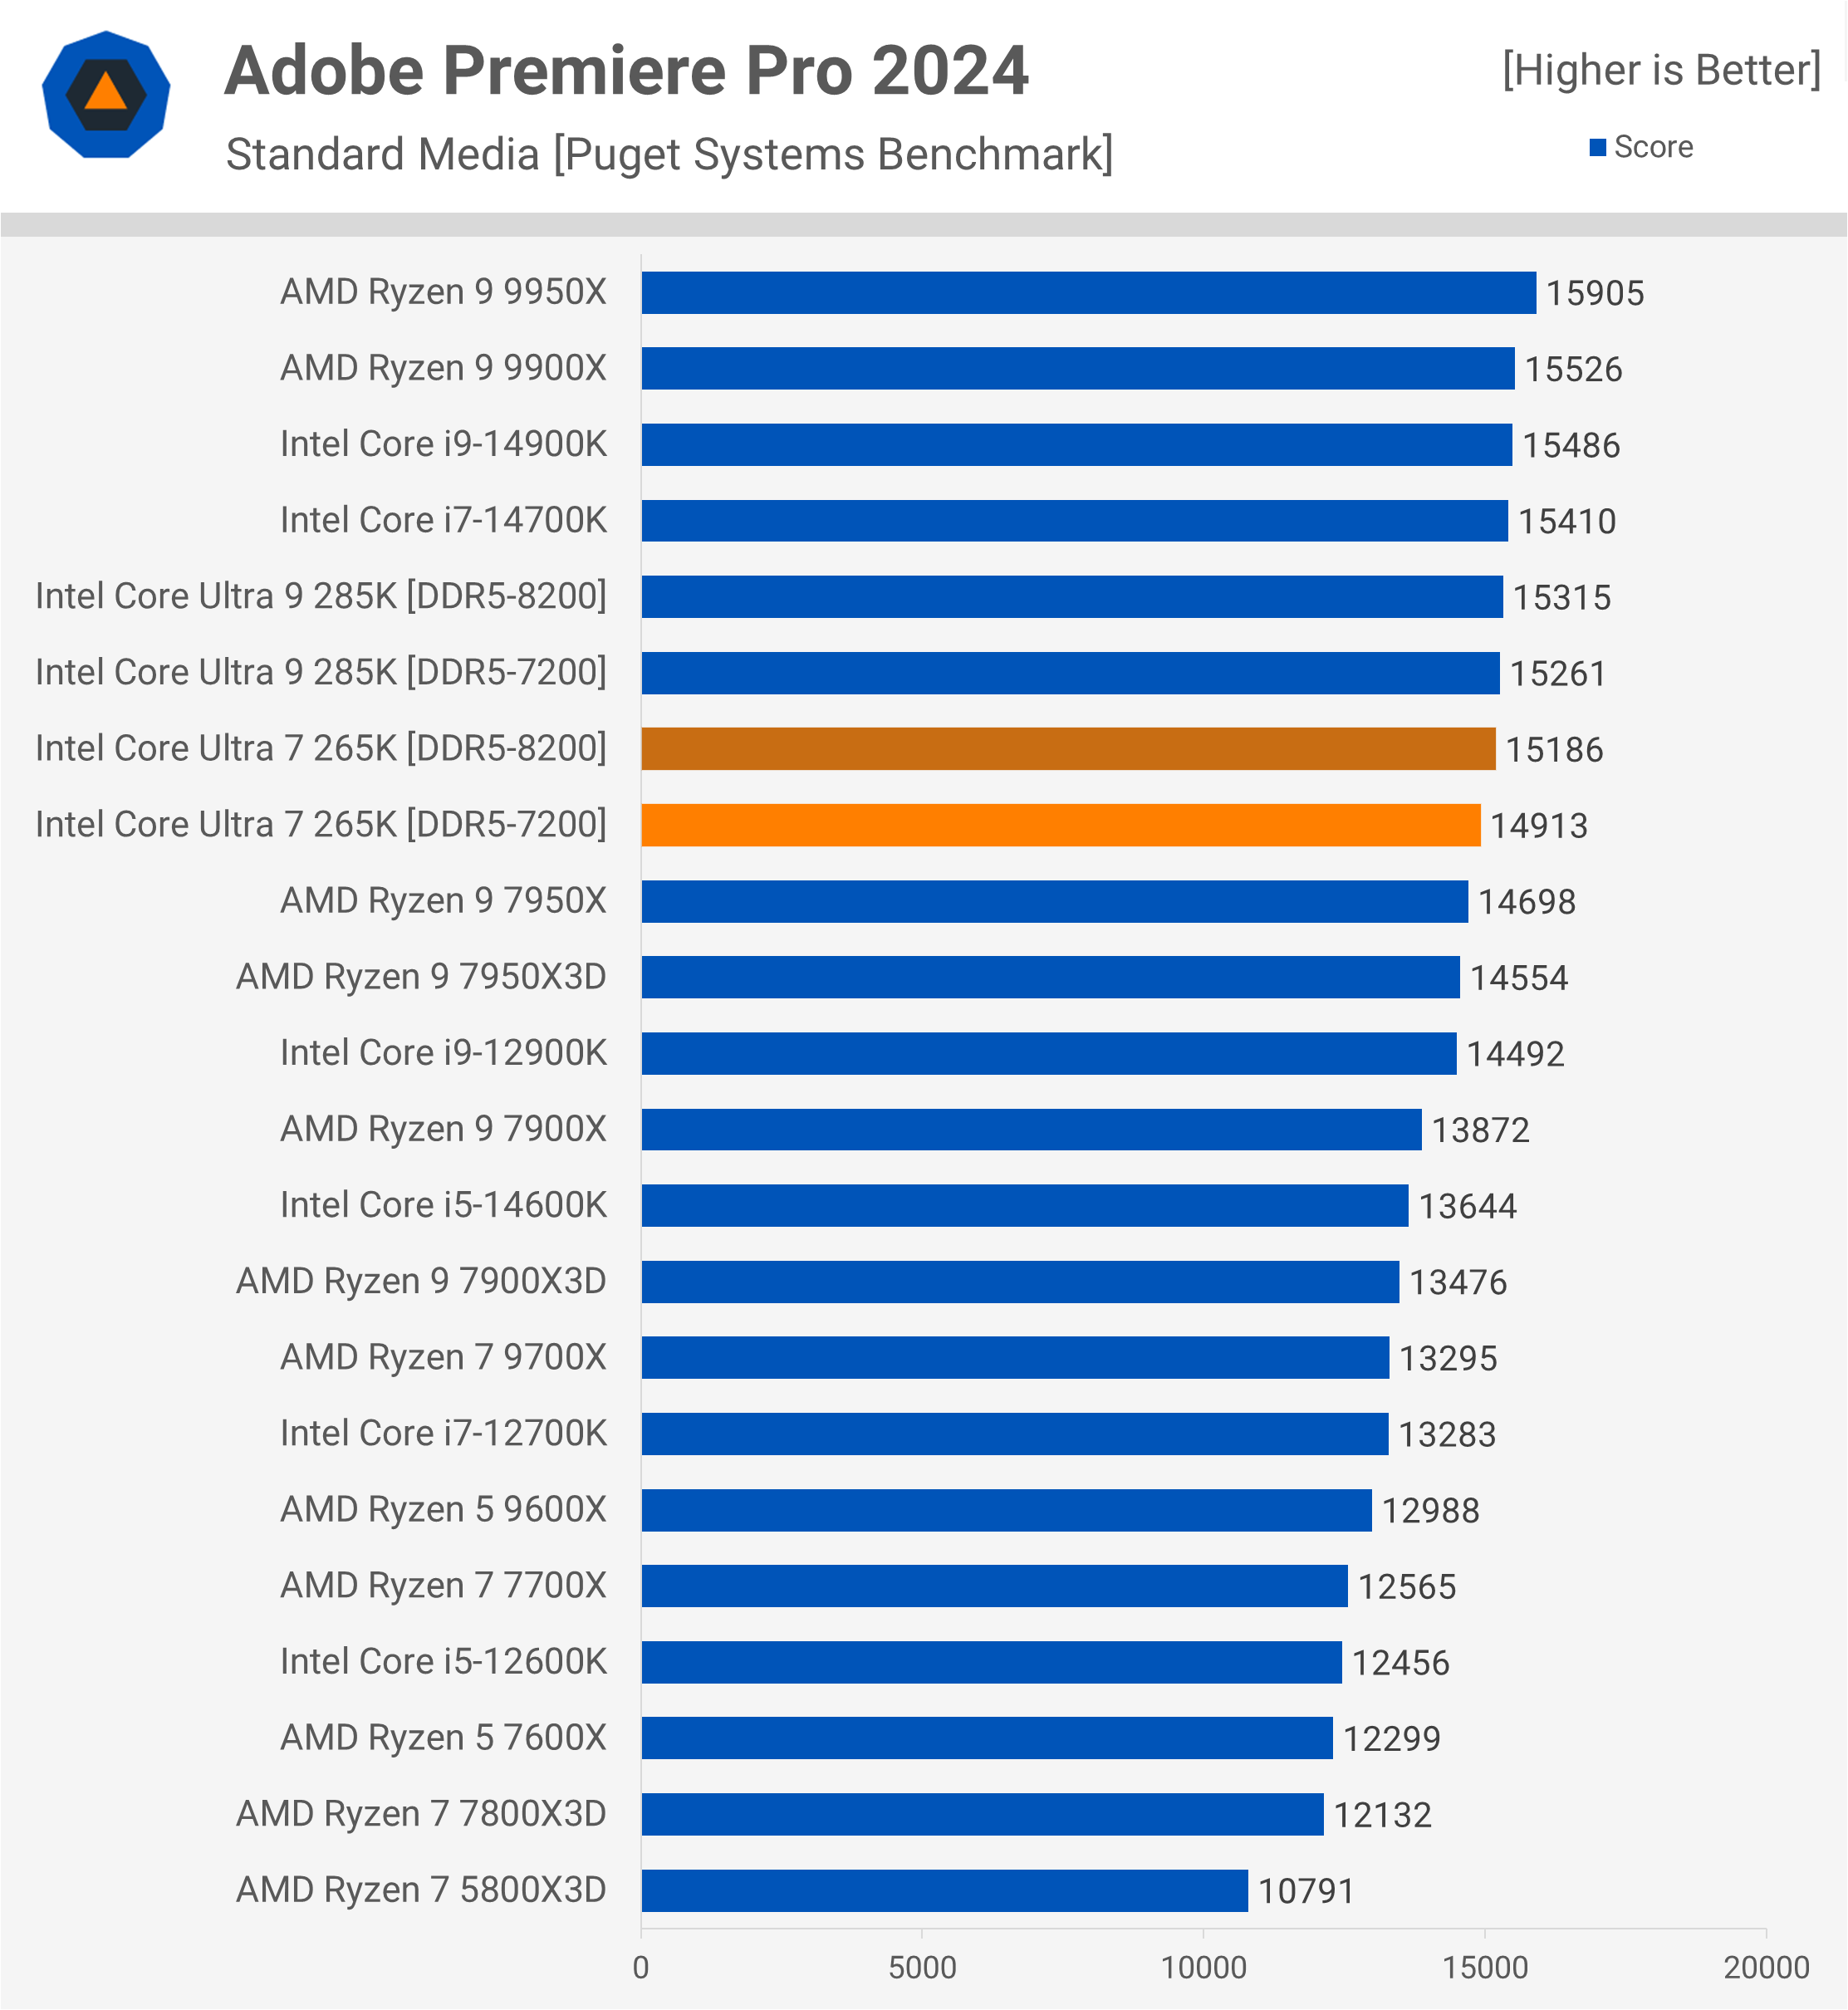
Adobe Premiere Pro 2024
Performance in Premiere Pro is an improvement, but ultimately still underwhelming. The 265K lags behind both the 14700K and the 9900X.
Gaming Benchmarks
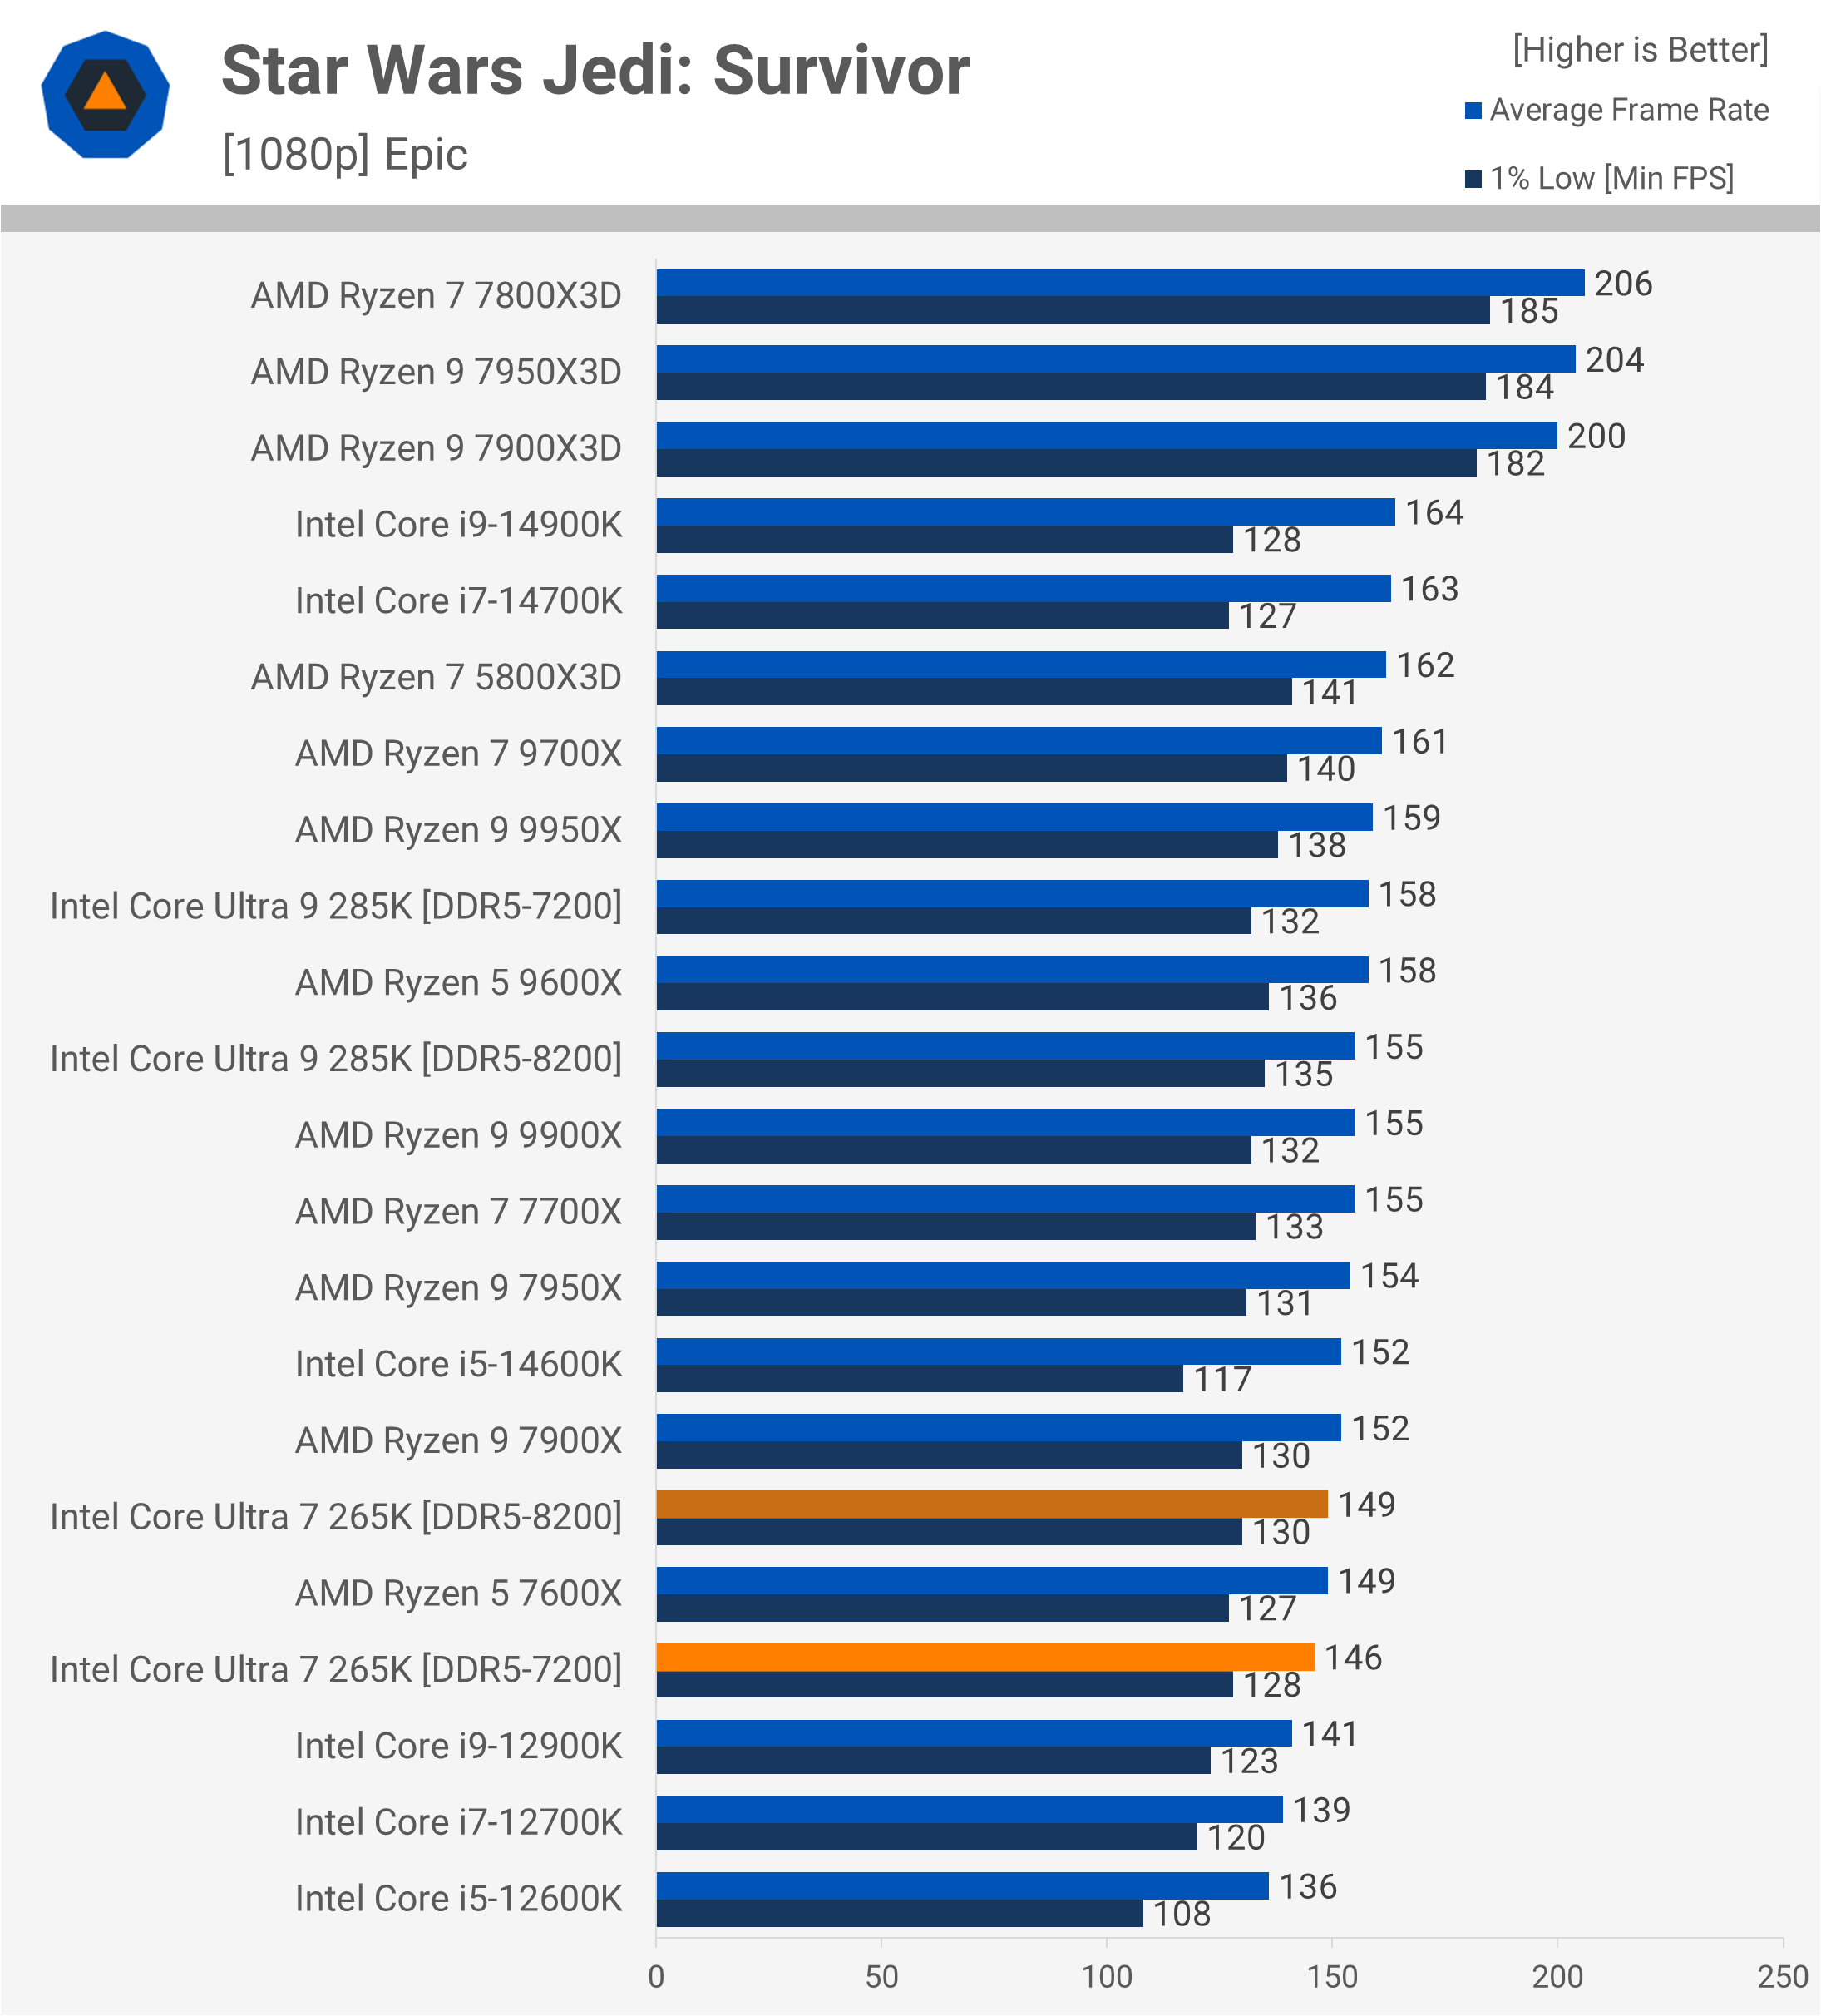
Star Wars Jedi: Survivor
Starting with the gaming benchmarks, let’s take a look at Star Wars Jedi: Survivor, where the 265K performs poorly, trailing behind all competing parts. Using the same DDR5-7200 memory, it is 10% slower than the 14700K, 9% slower than the 9700X, and even 6% slower than the 9900X, which isn’t typically regarded as a top gaming CPU.
For elite gaming performance, the 7800X3D remains a better option, outperforming the 265K by nearly 30%.
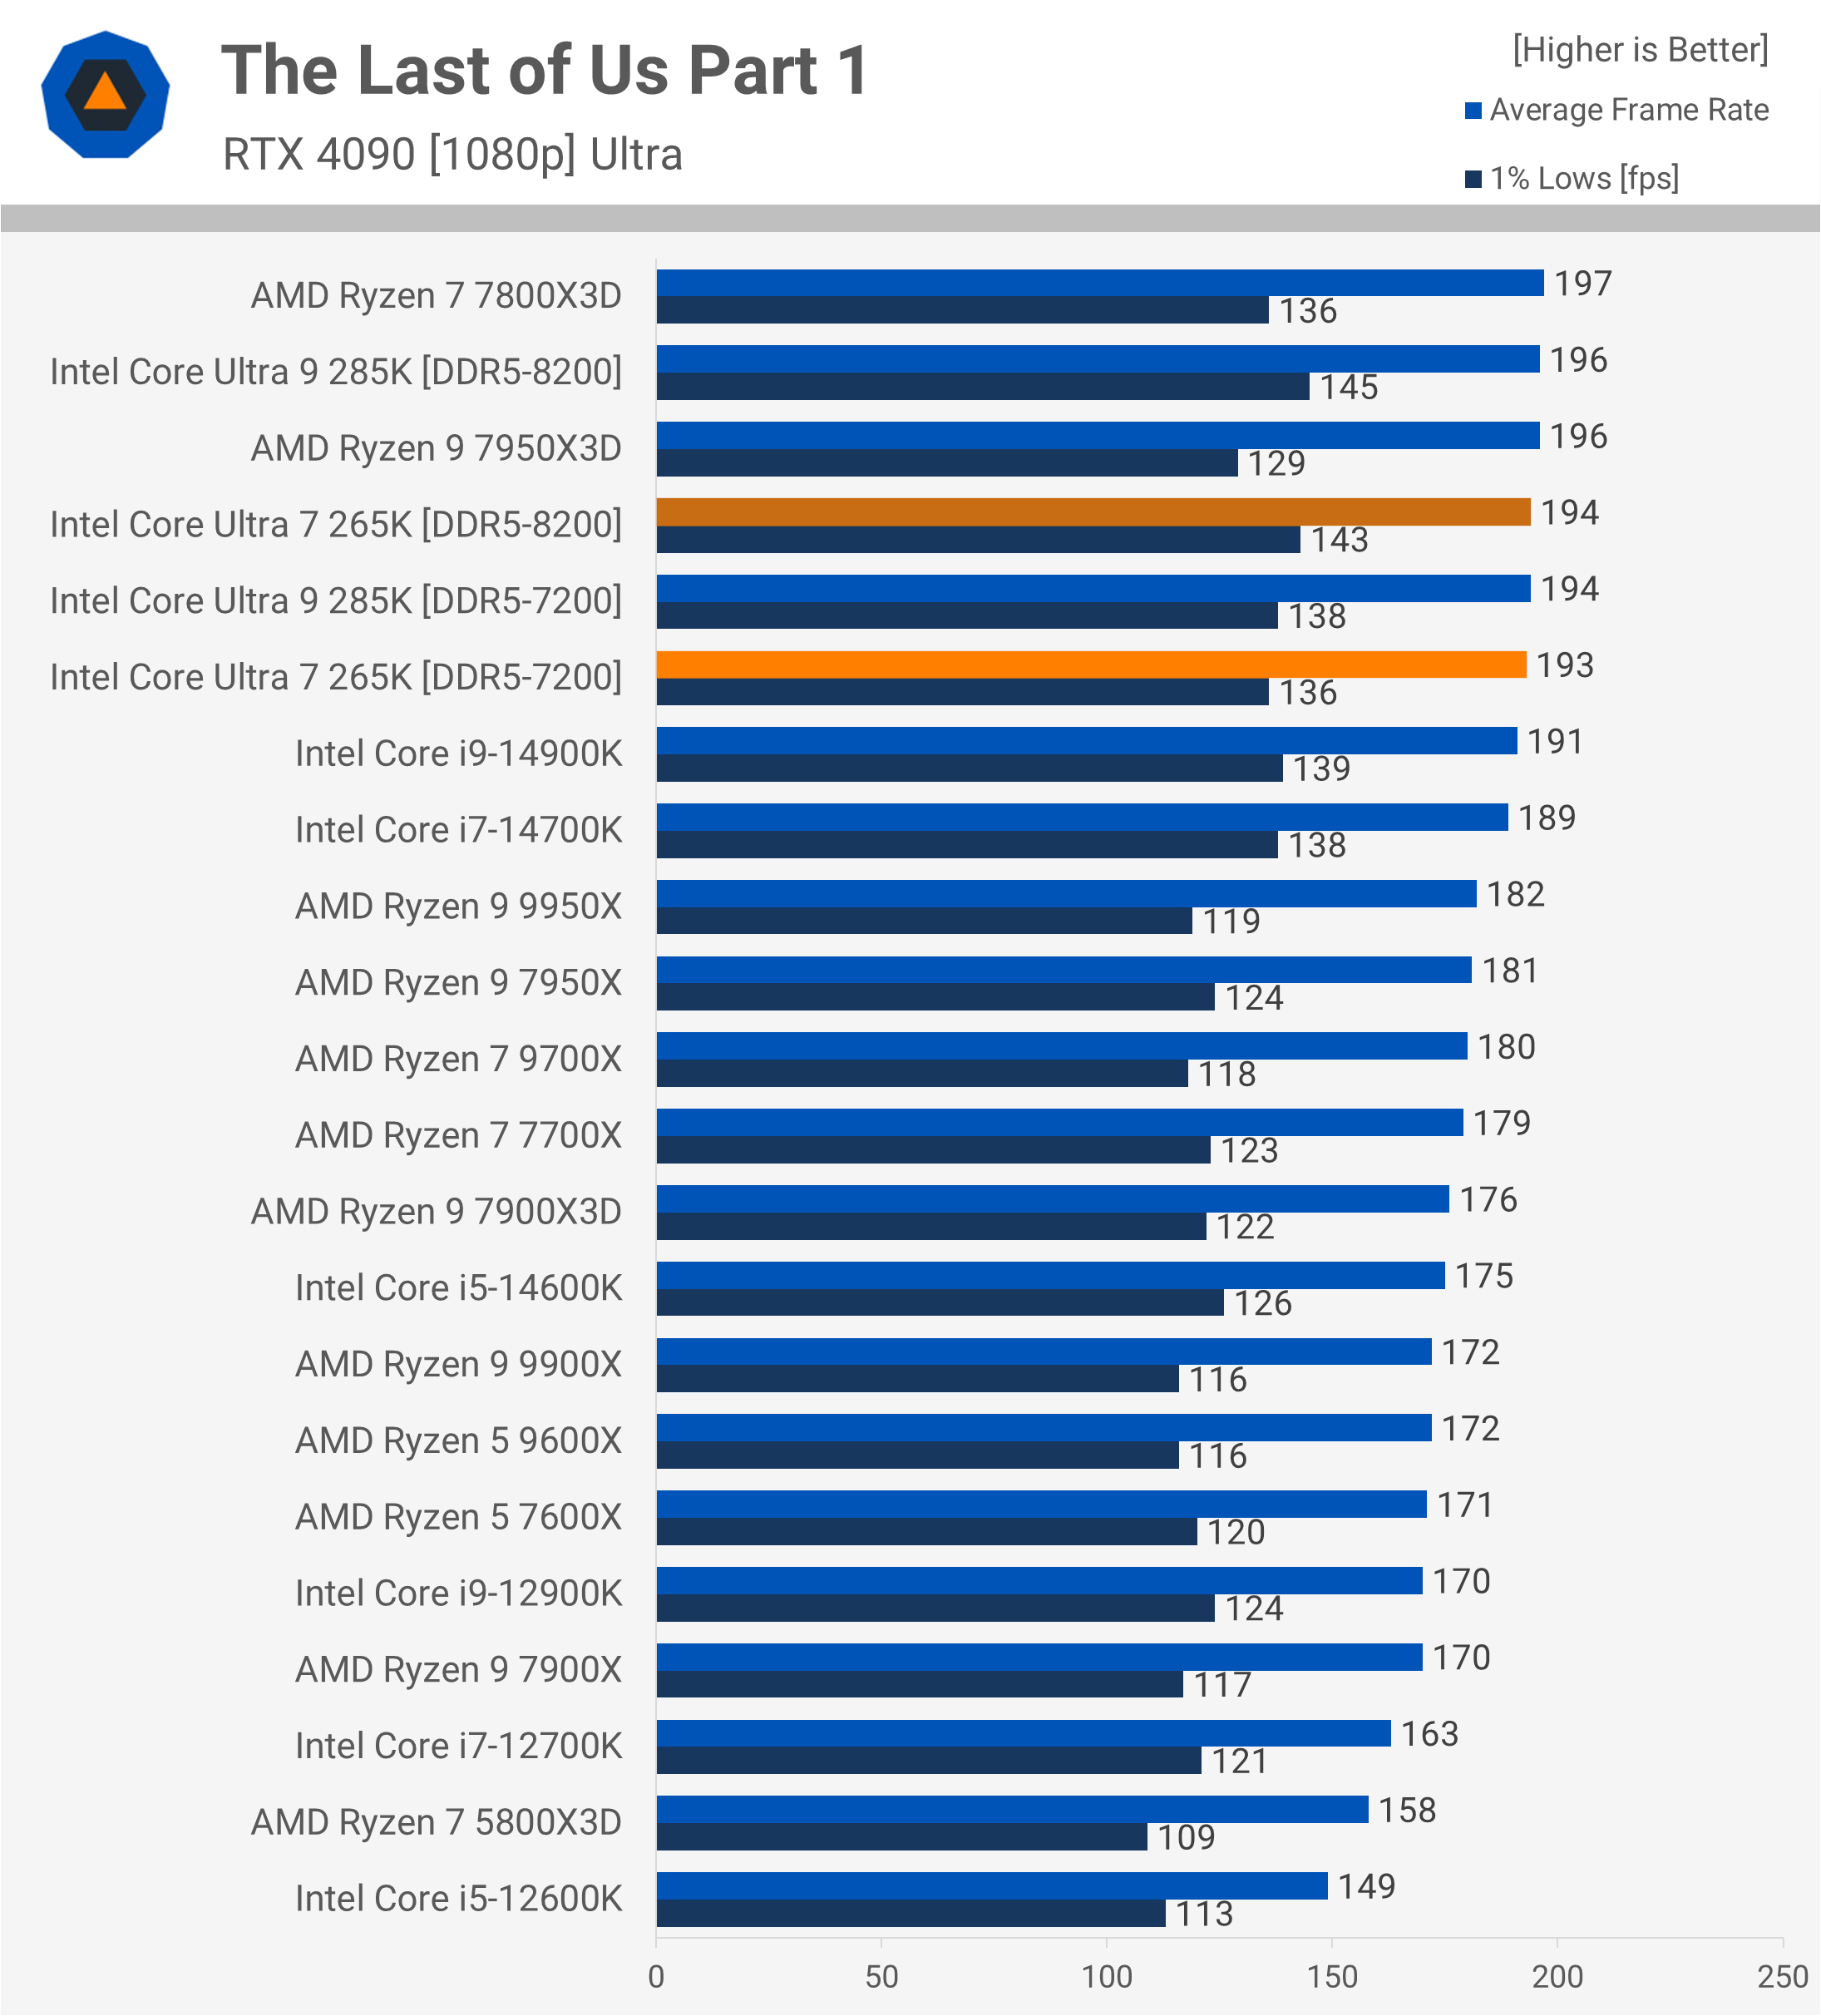
The Last of Us Part 1
Next, we examine The Last of Us Part 1, where the 265K performs well, slightly edging out both the 14900K and 14700K. While this may not be impressive for a next-generation product, it’s a marked improvement over its performance in Jedi Survivor. Additionally, the 265K is 12% faster than the 9900X in this test.
Cyberpunk 2077: Phantom Liberty
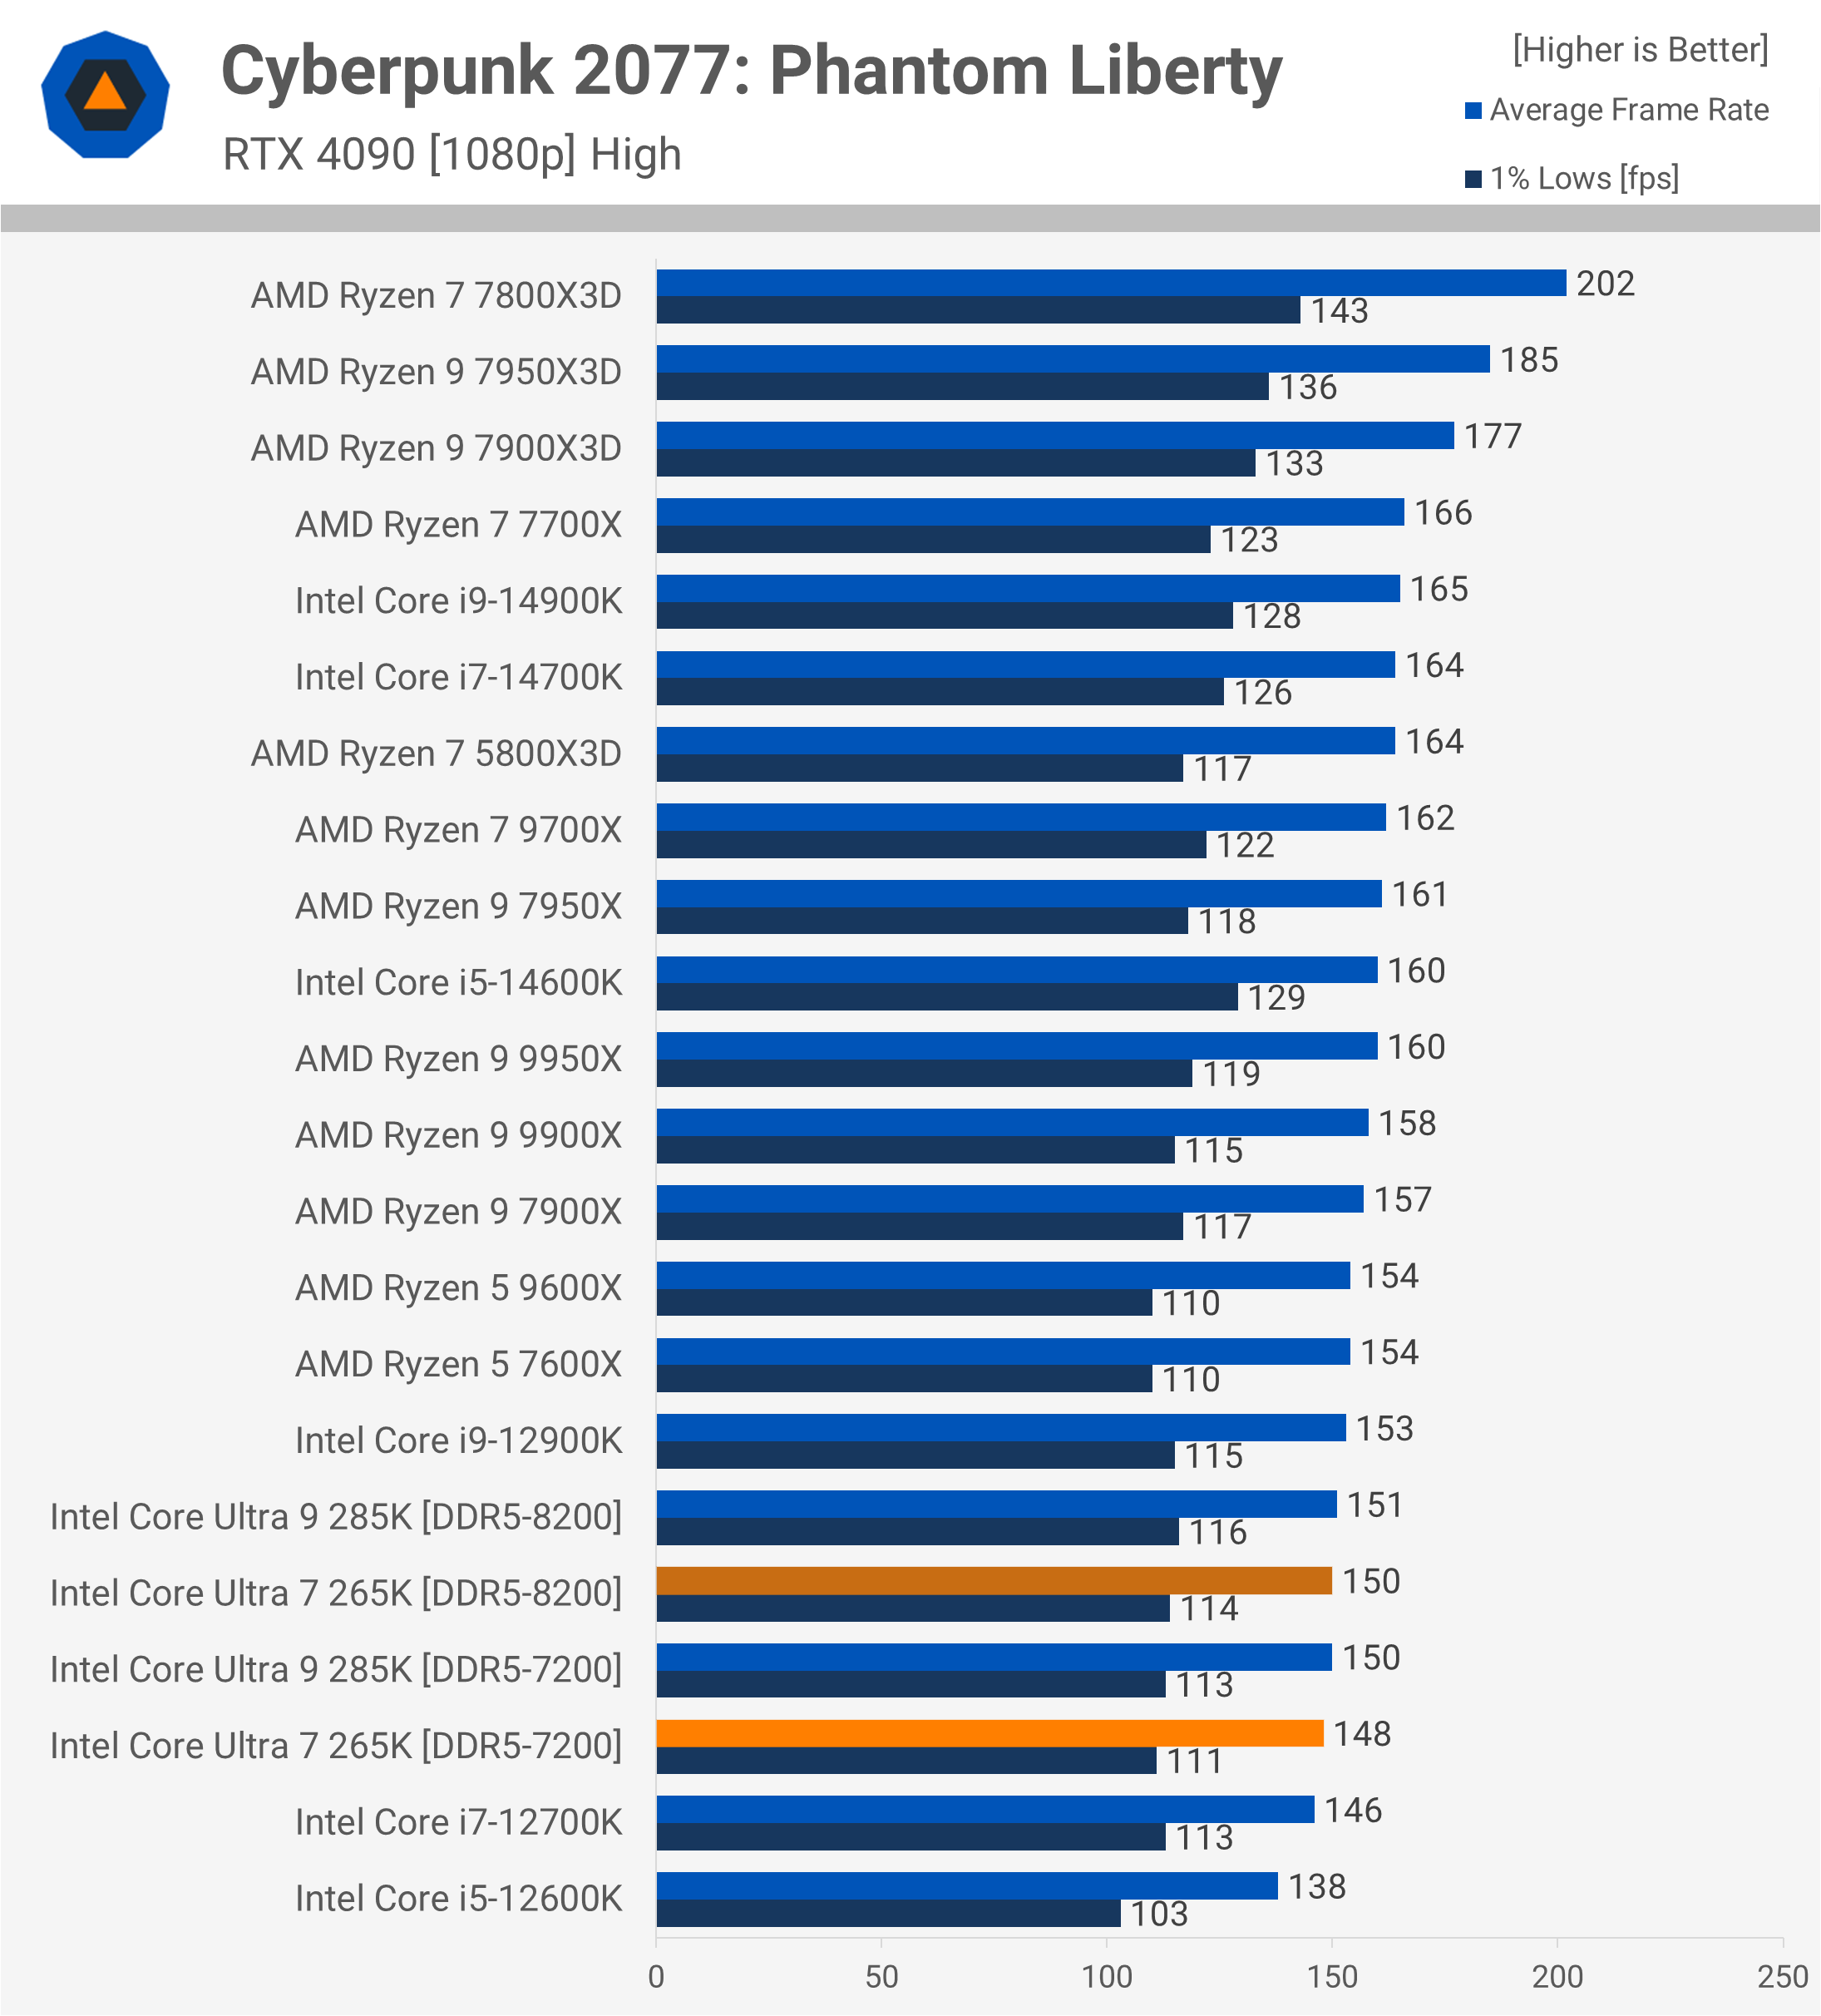
Our Cyberpunk 2077: Phantom Liberty results were poor in the 285K review, and we suspected a scheduling issue, so we disabled the E-cores within the BIOS, but that didn’t yield improvements. However, enabling the ‘Prioritize P-Cores’ setting in the Hybrid CPU Utilization improved performance by around 15%.
With the 265K optimized for this test, it achieved an average of 148 fps using DDR5-7200. Yet, even with this tuning, it was still 10% slower than the 14700K. While better than previous results, it’s still notably disappointing.
Hogwarts Legacy
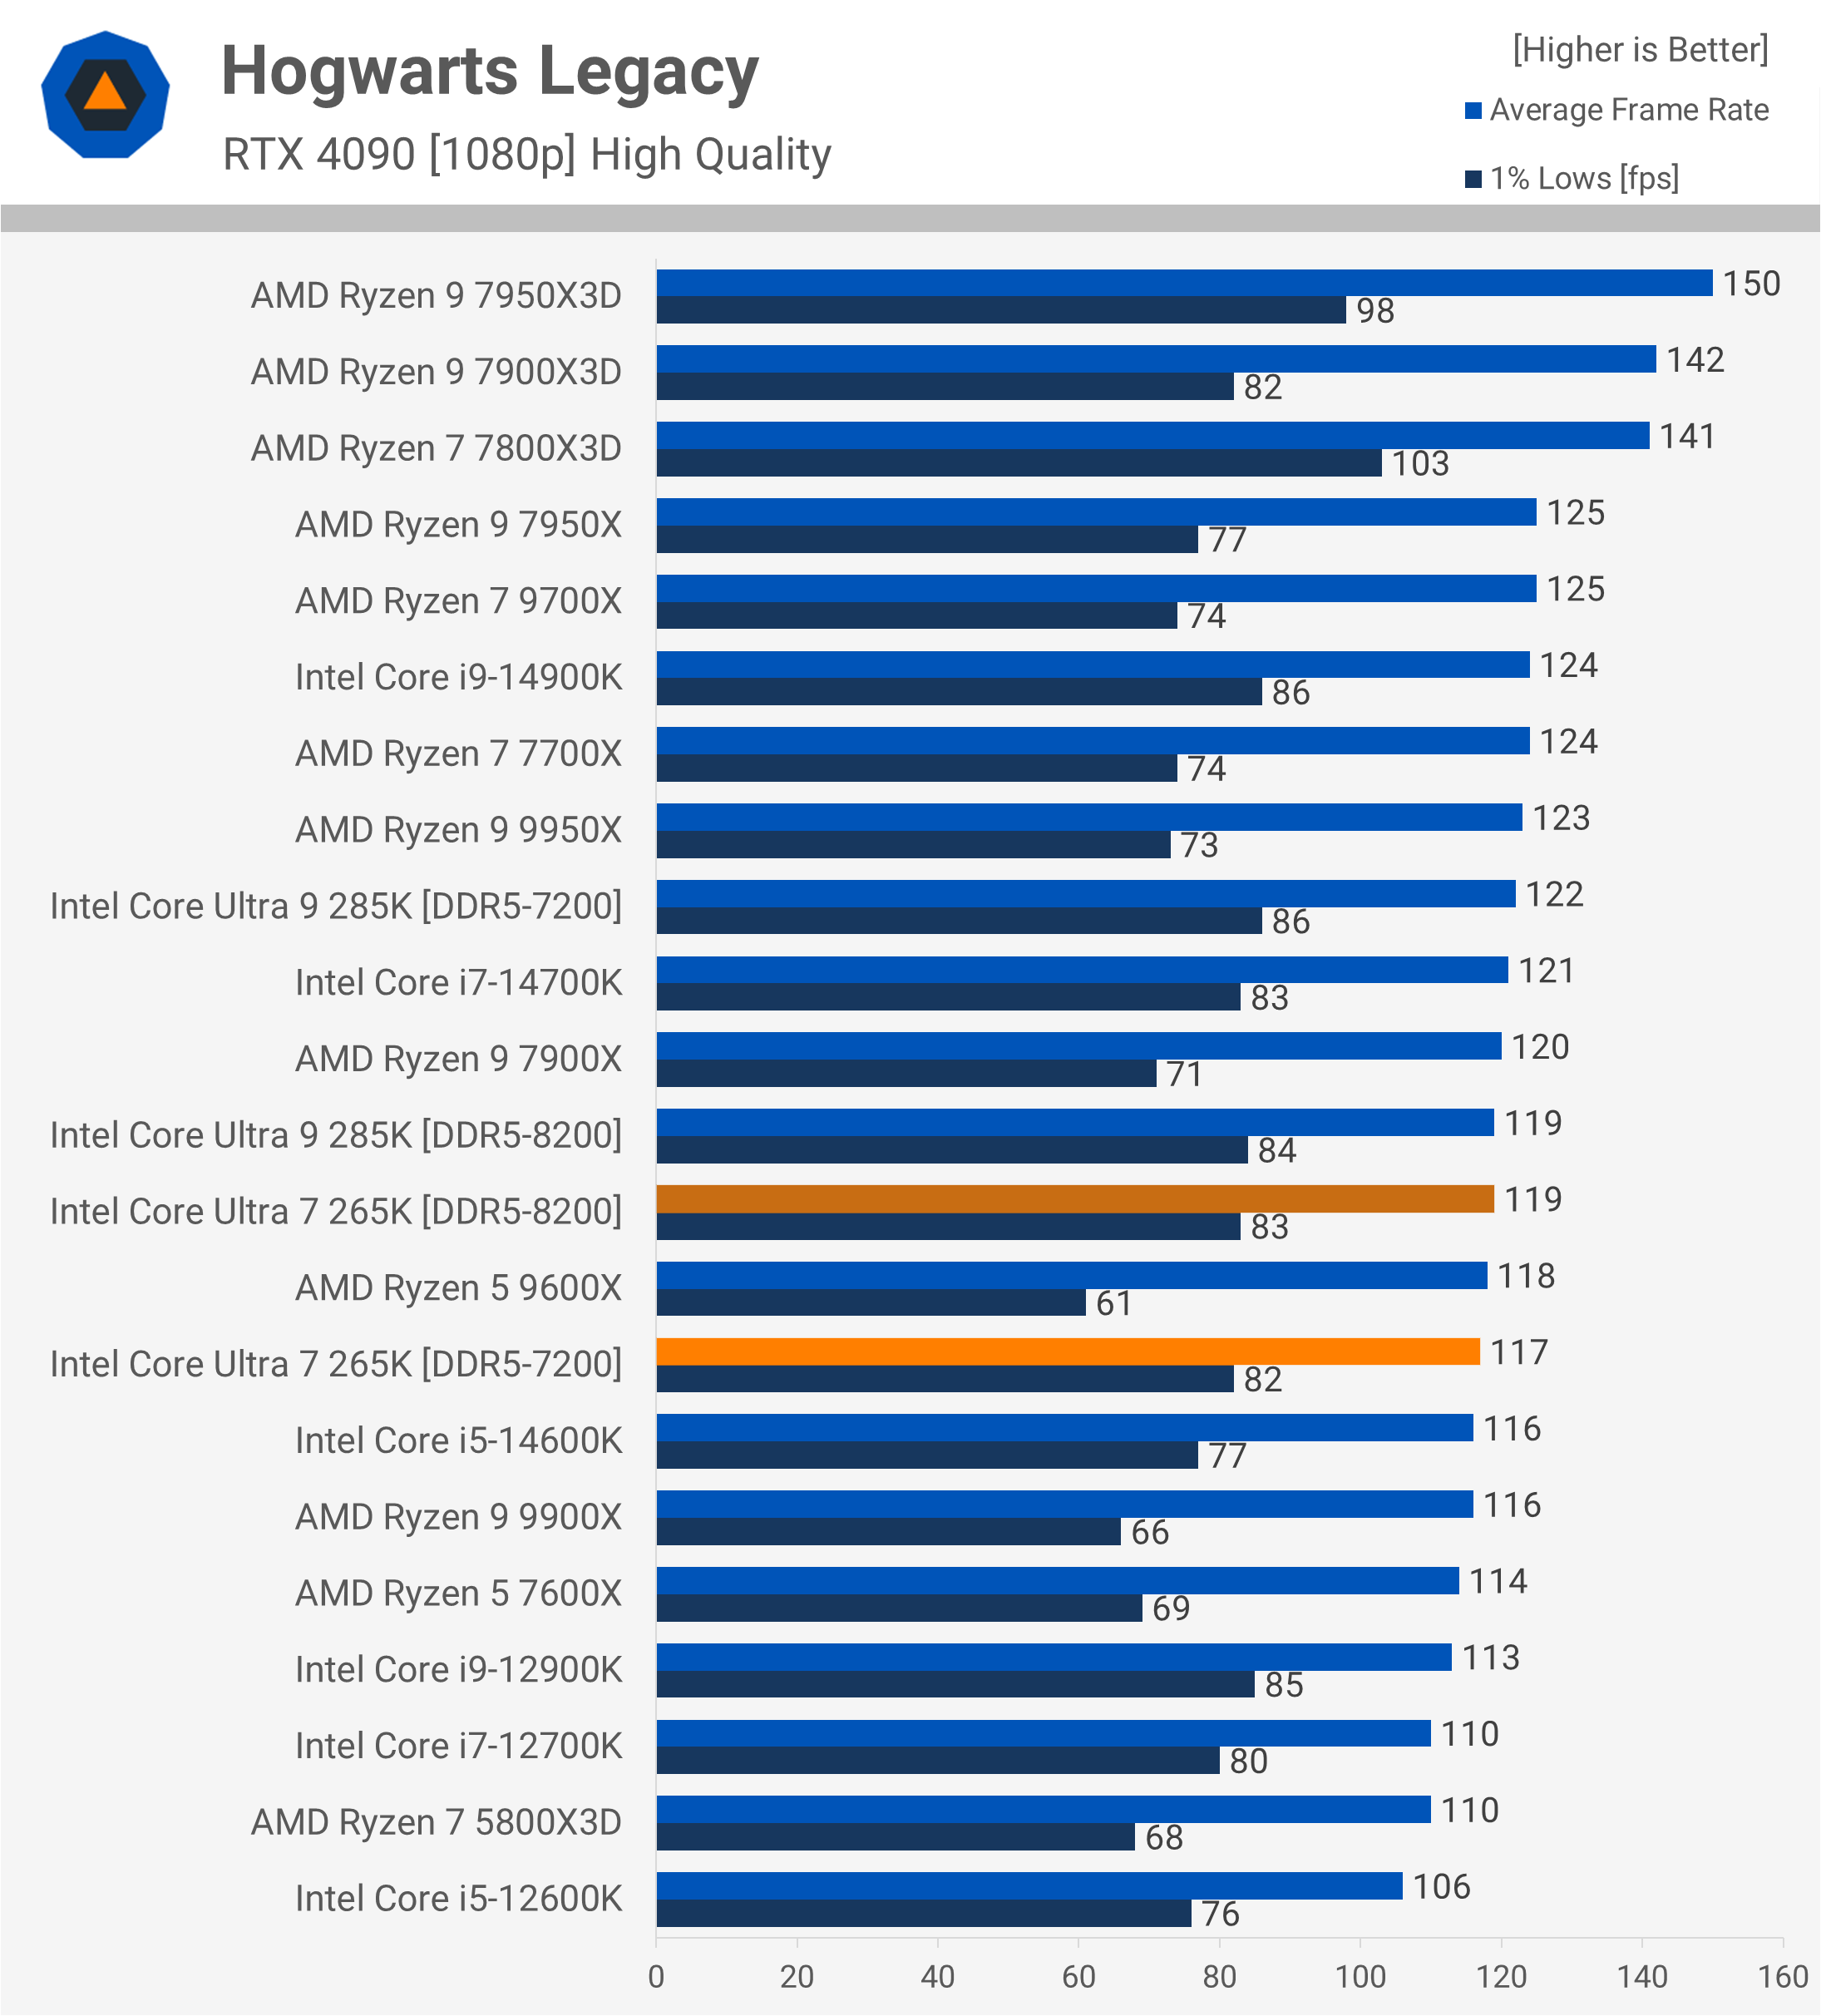
In Hogwarts Legacy, the 265K’s performance is mid-tier, placing it closer to the 9600X and 14600K than to the 9700X, with the 7800X3D remaining well out of reach.
Assetto Corsa Competizione
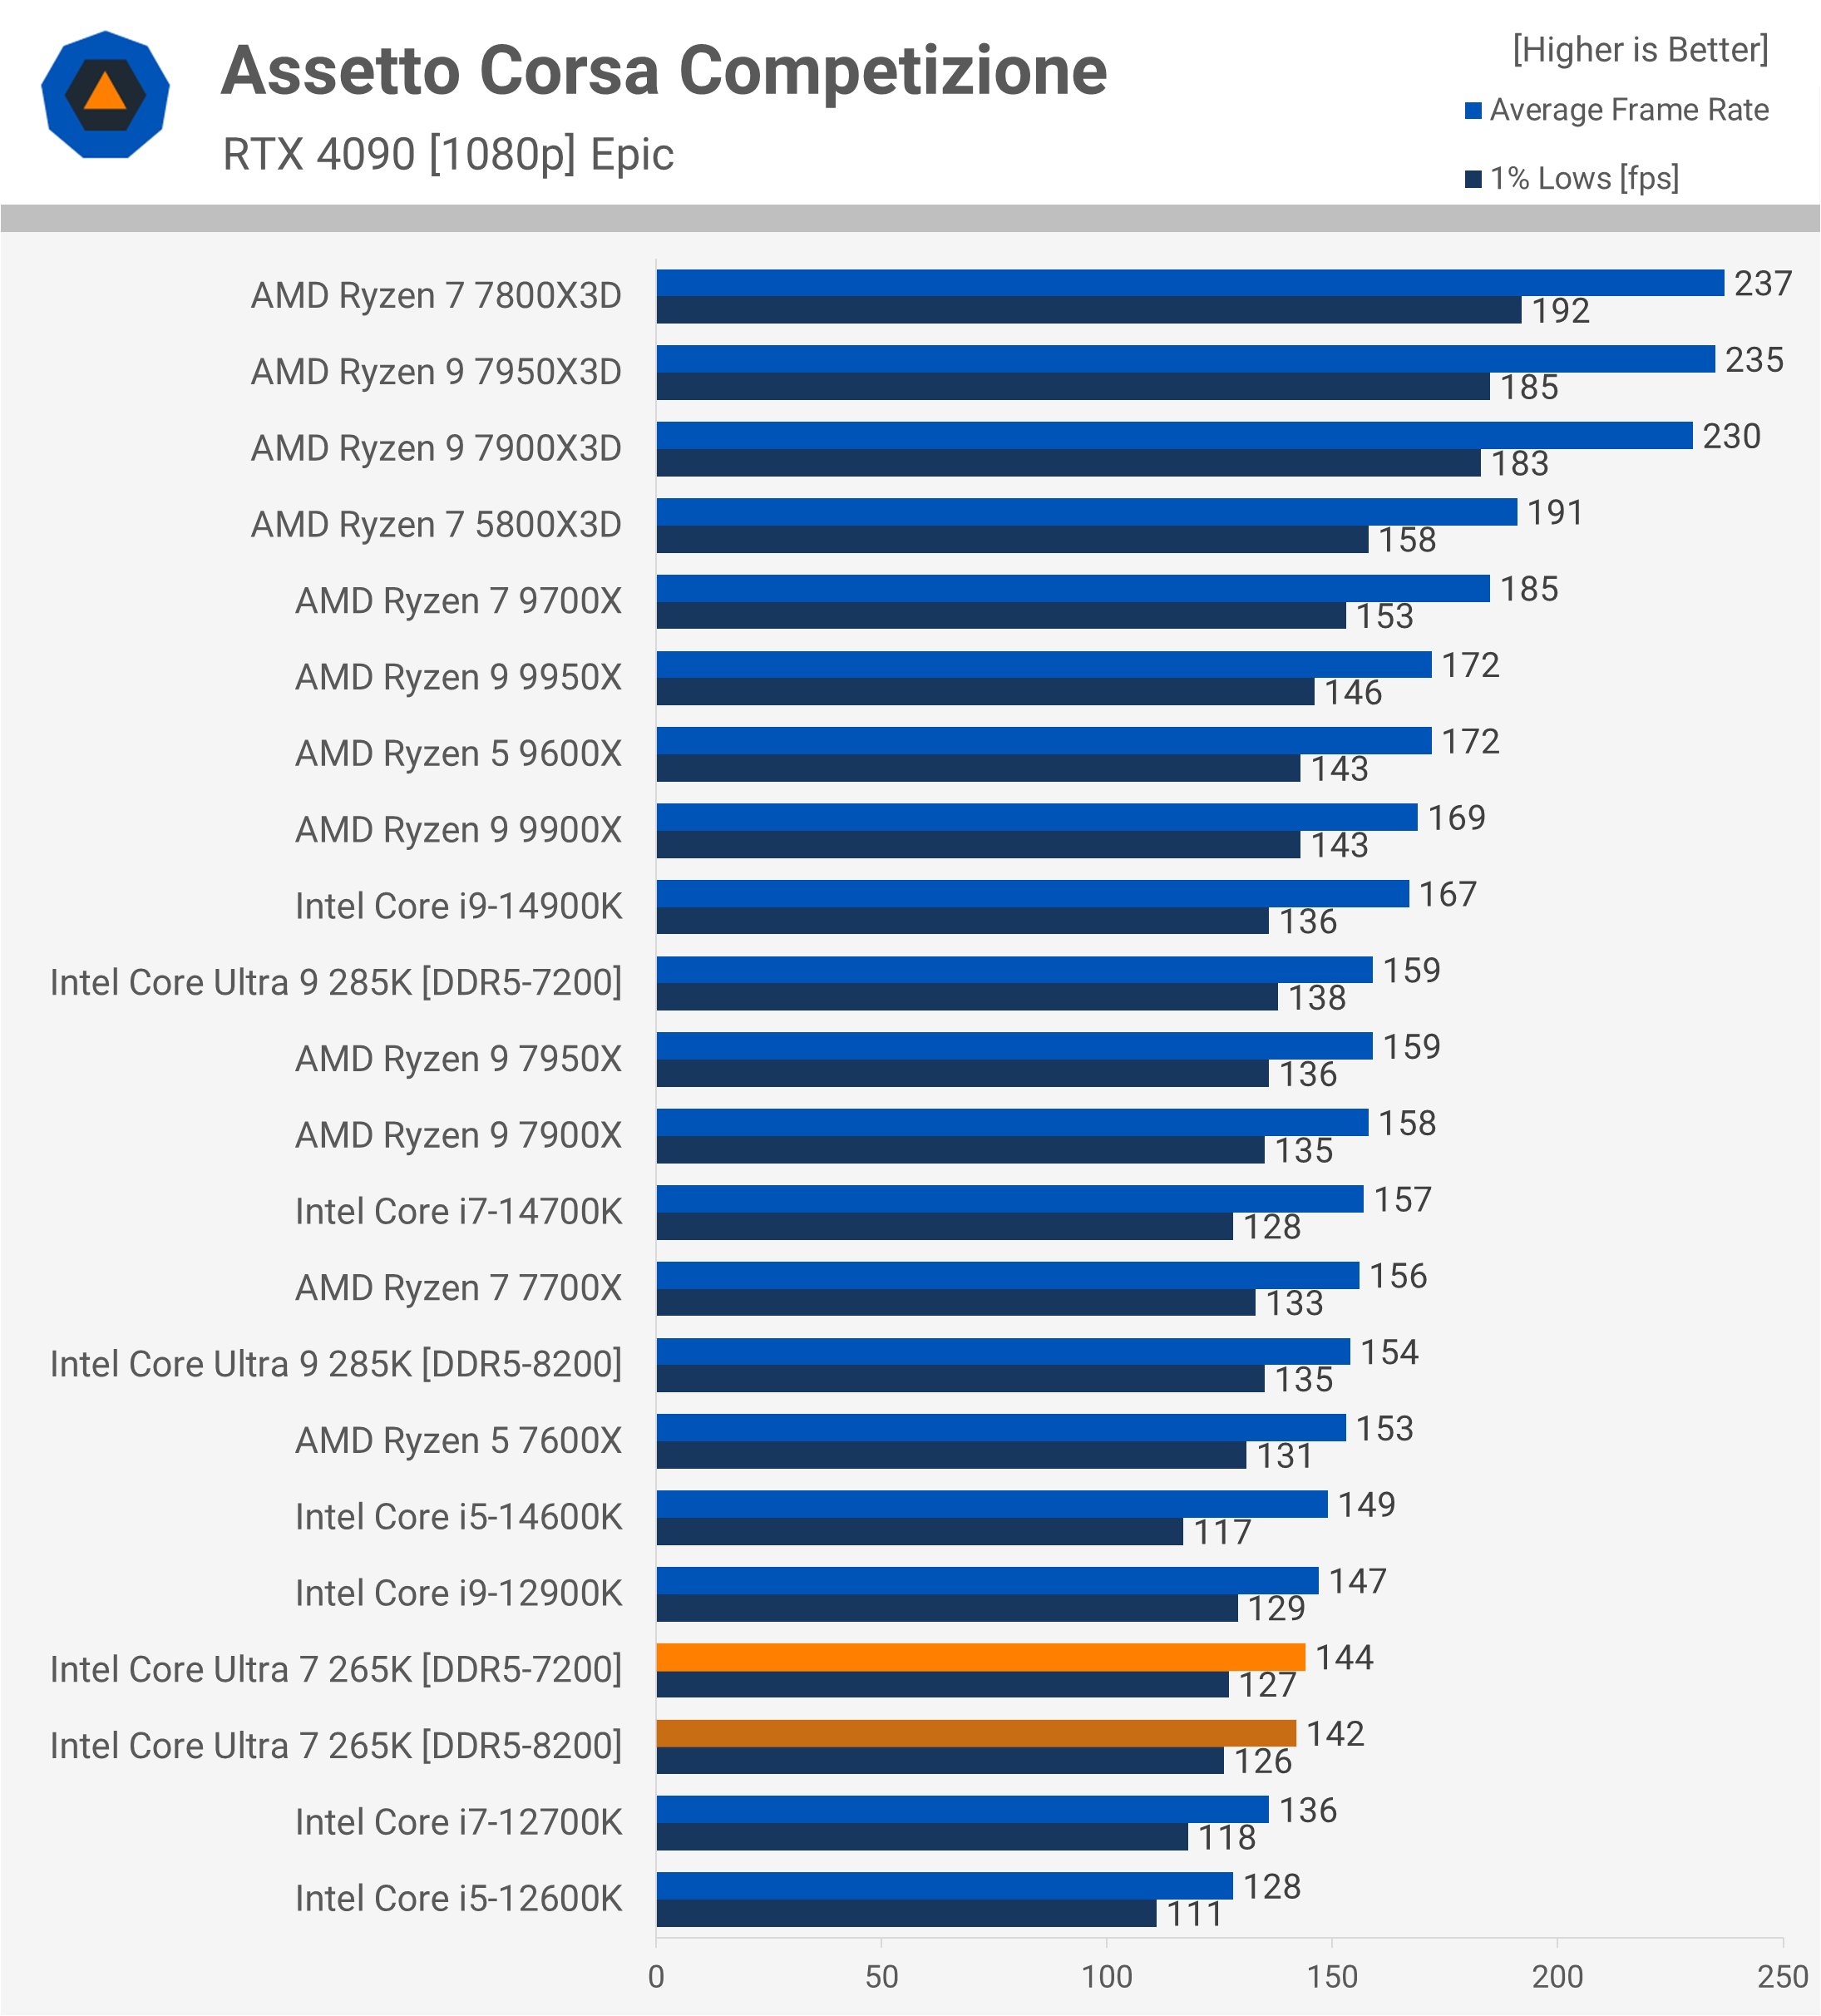
The 265K also underperforms in Assetto Corsa Competizione, lagging behind the 12900K and only slightly outperforming the older 12700K. Consequently, it was 8% slower than the 14700K, 15% slower than the 9900X, 22% slower than the 9700X, and 39% slower than the 7800X3D.
Remnant II
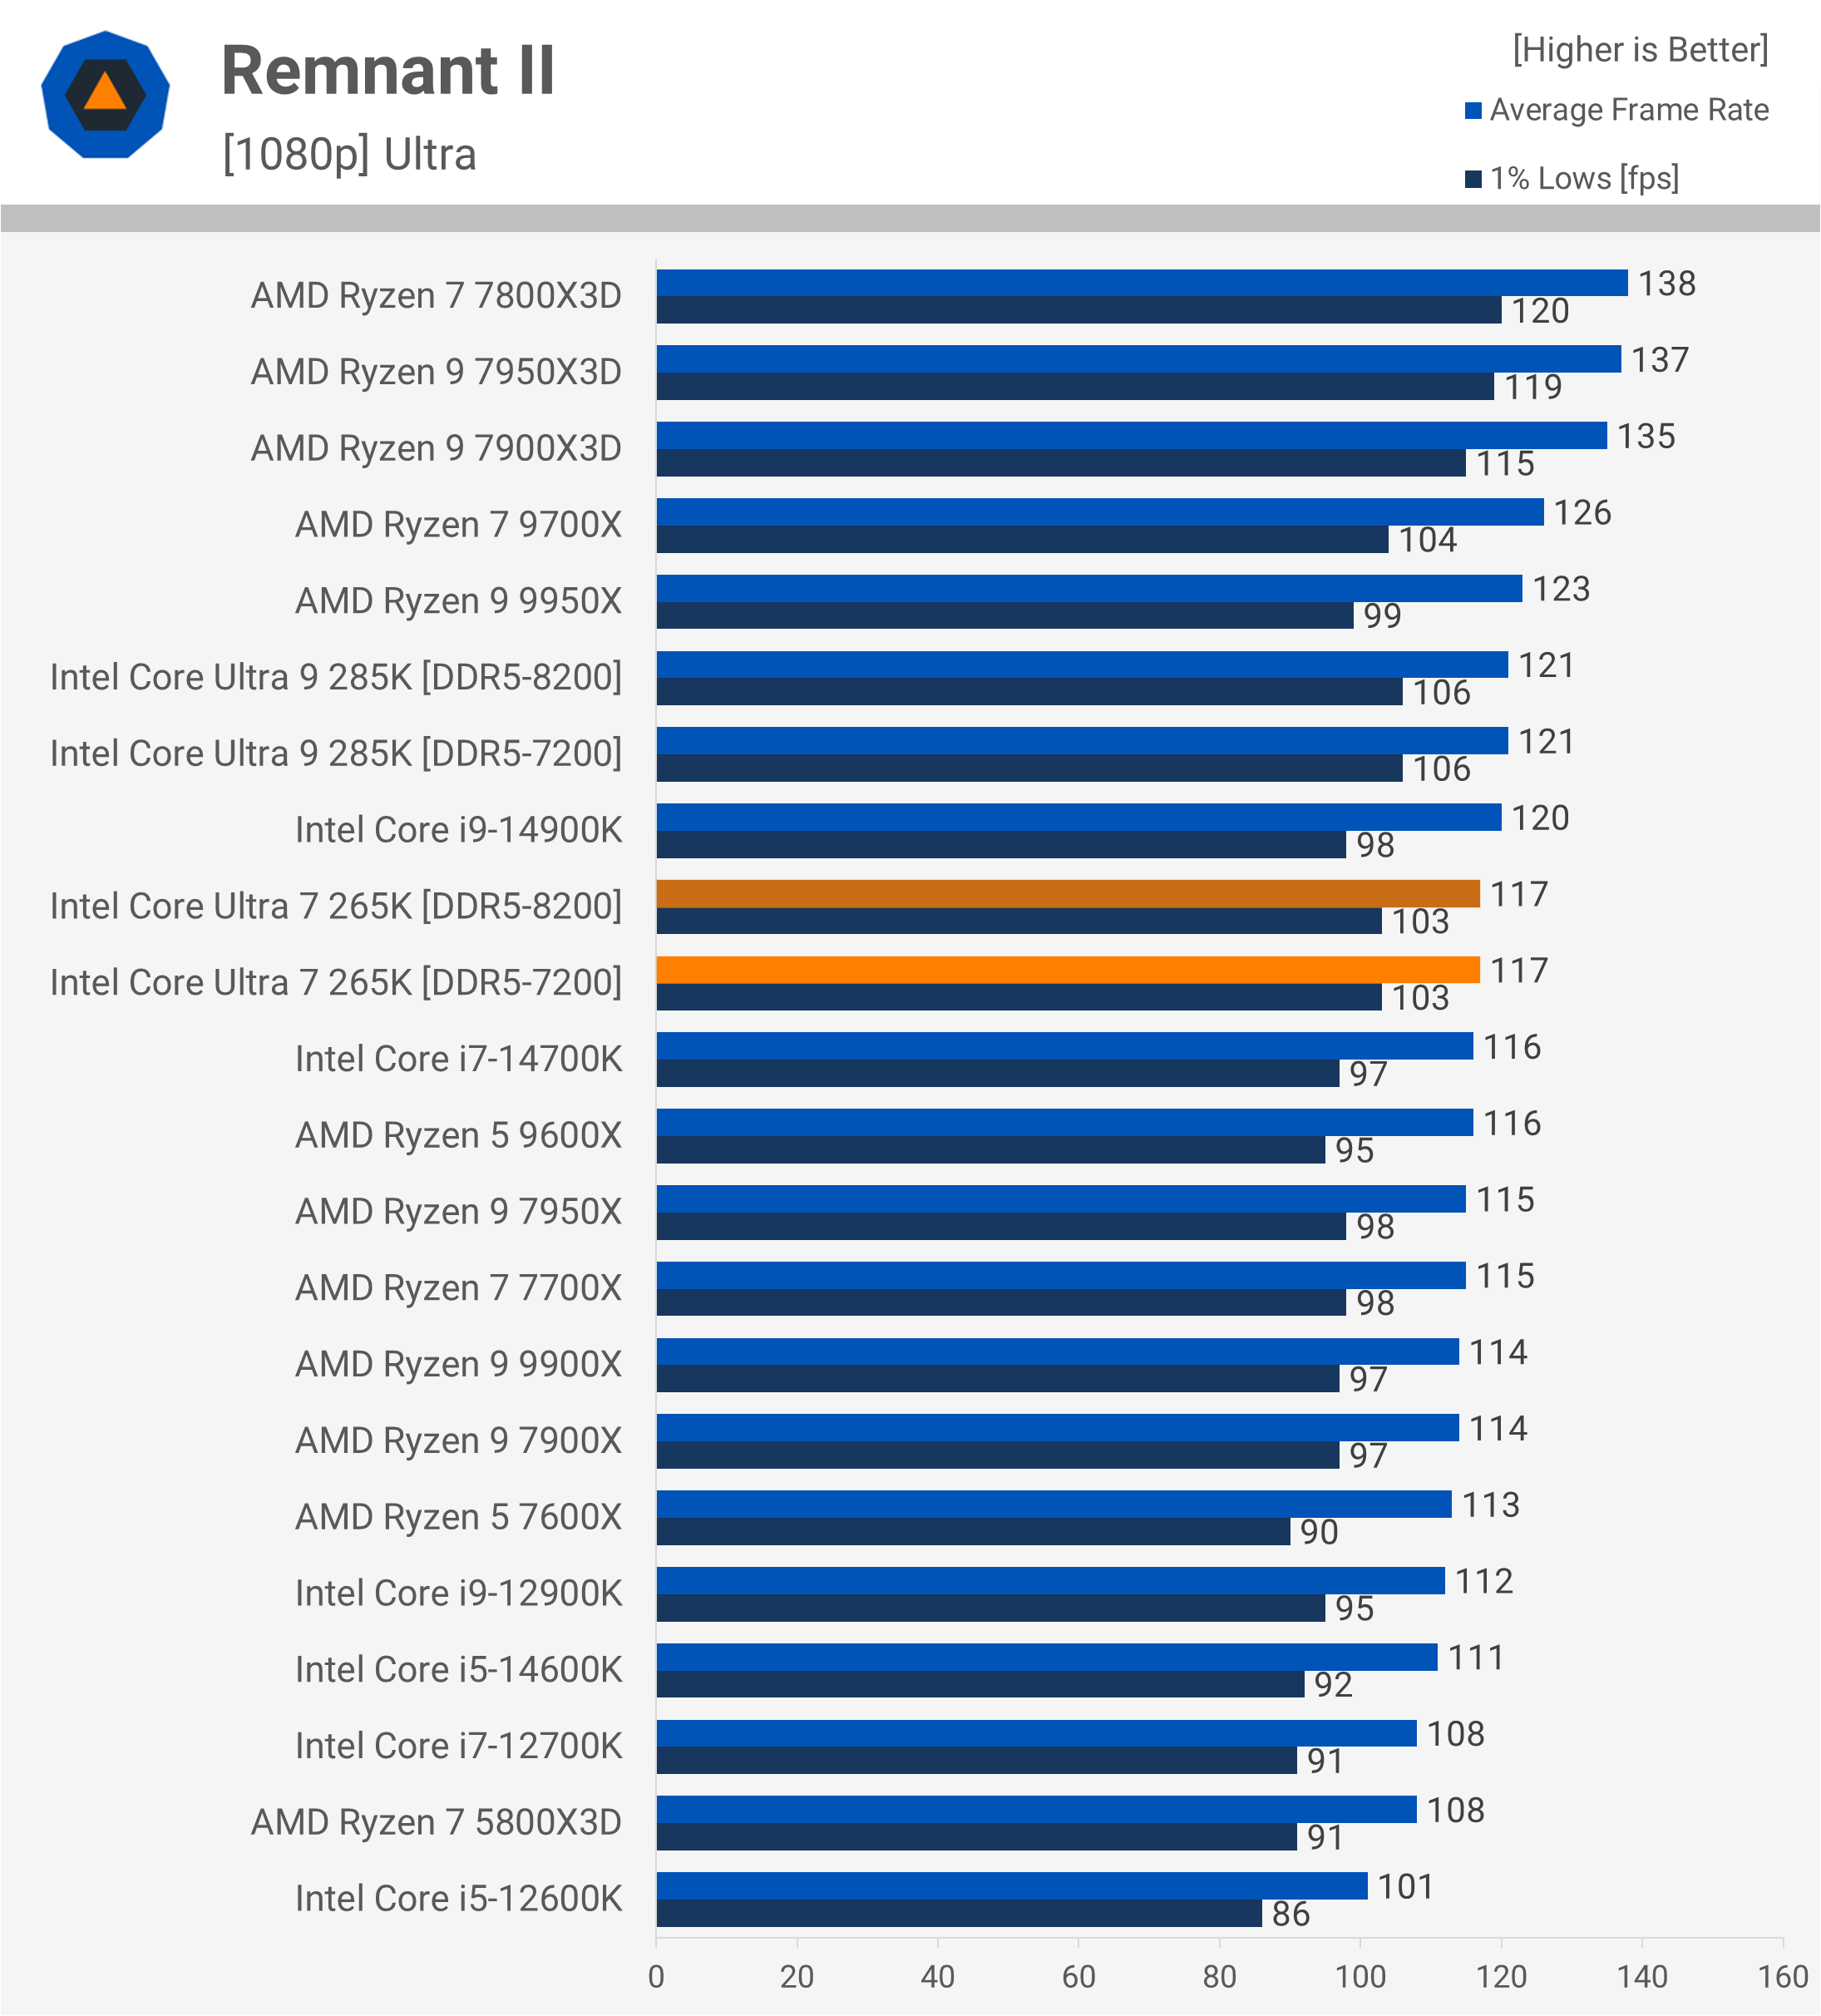
In Remnant II, the 265K provides similar performance to the 14700K, slightly outpacing the 9900X but falling 7% behind the 9700X and 15% behind the 7800X3D.
Homeworld 3
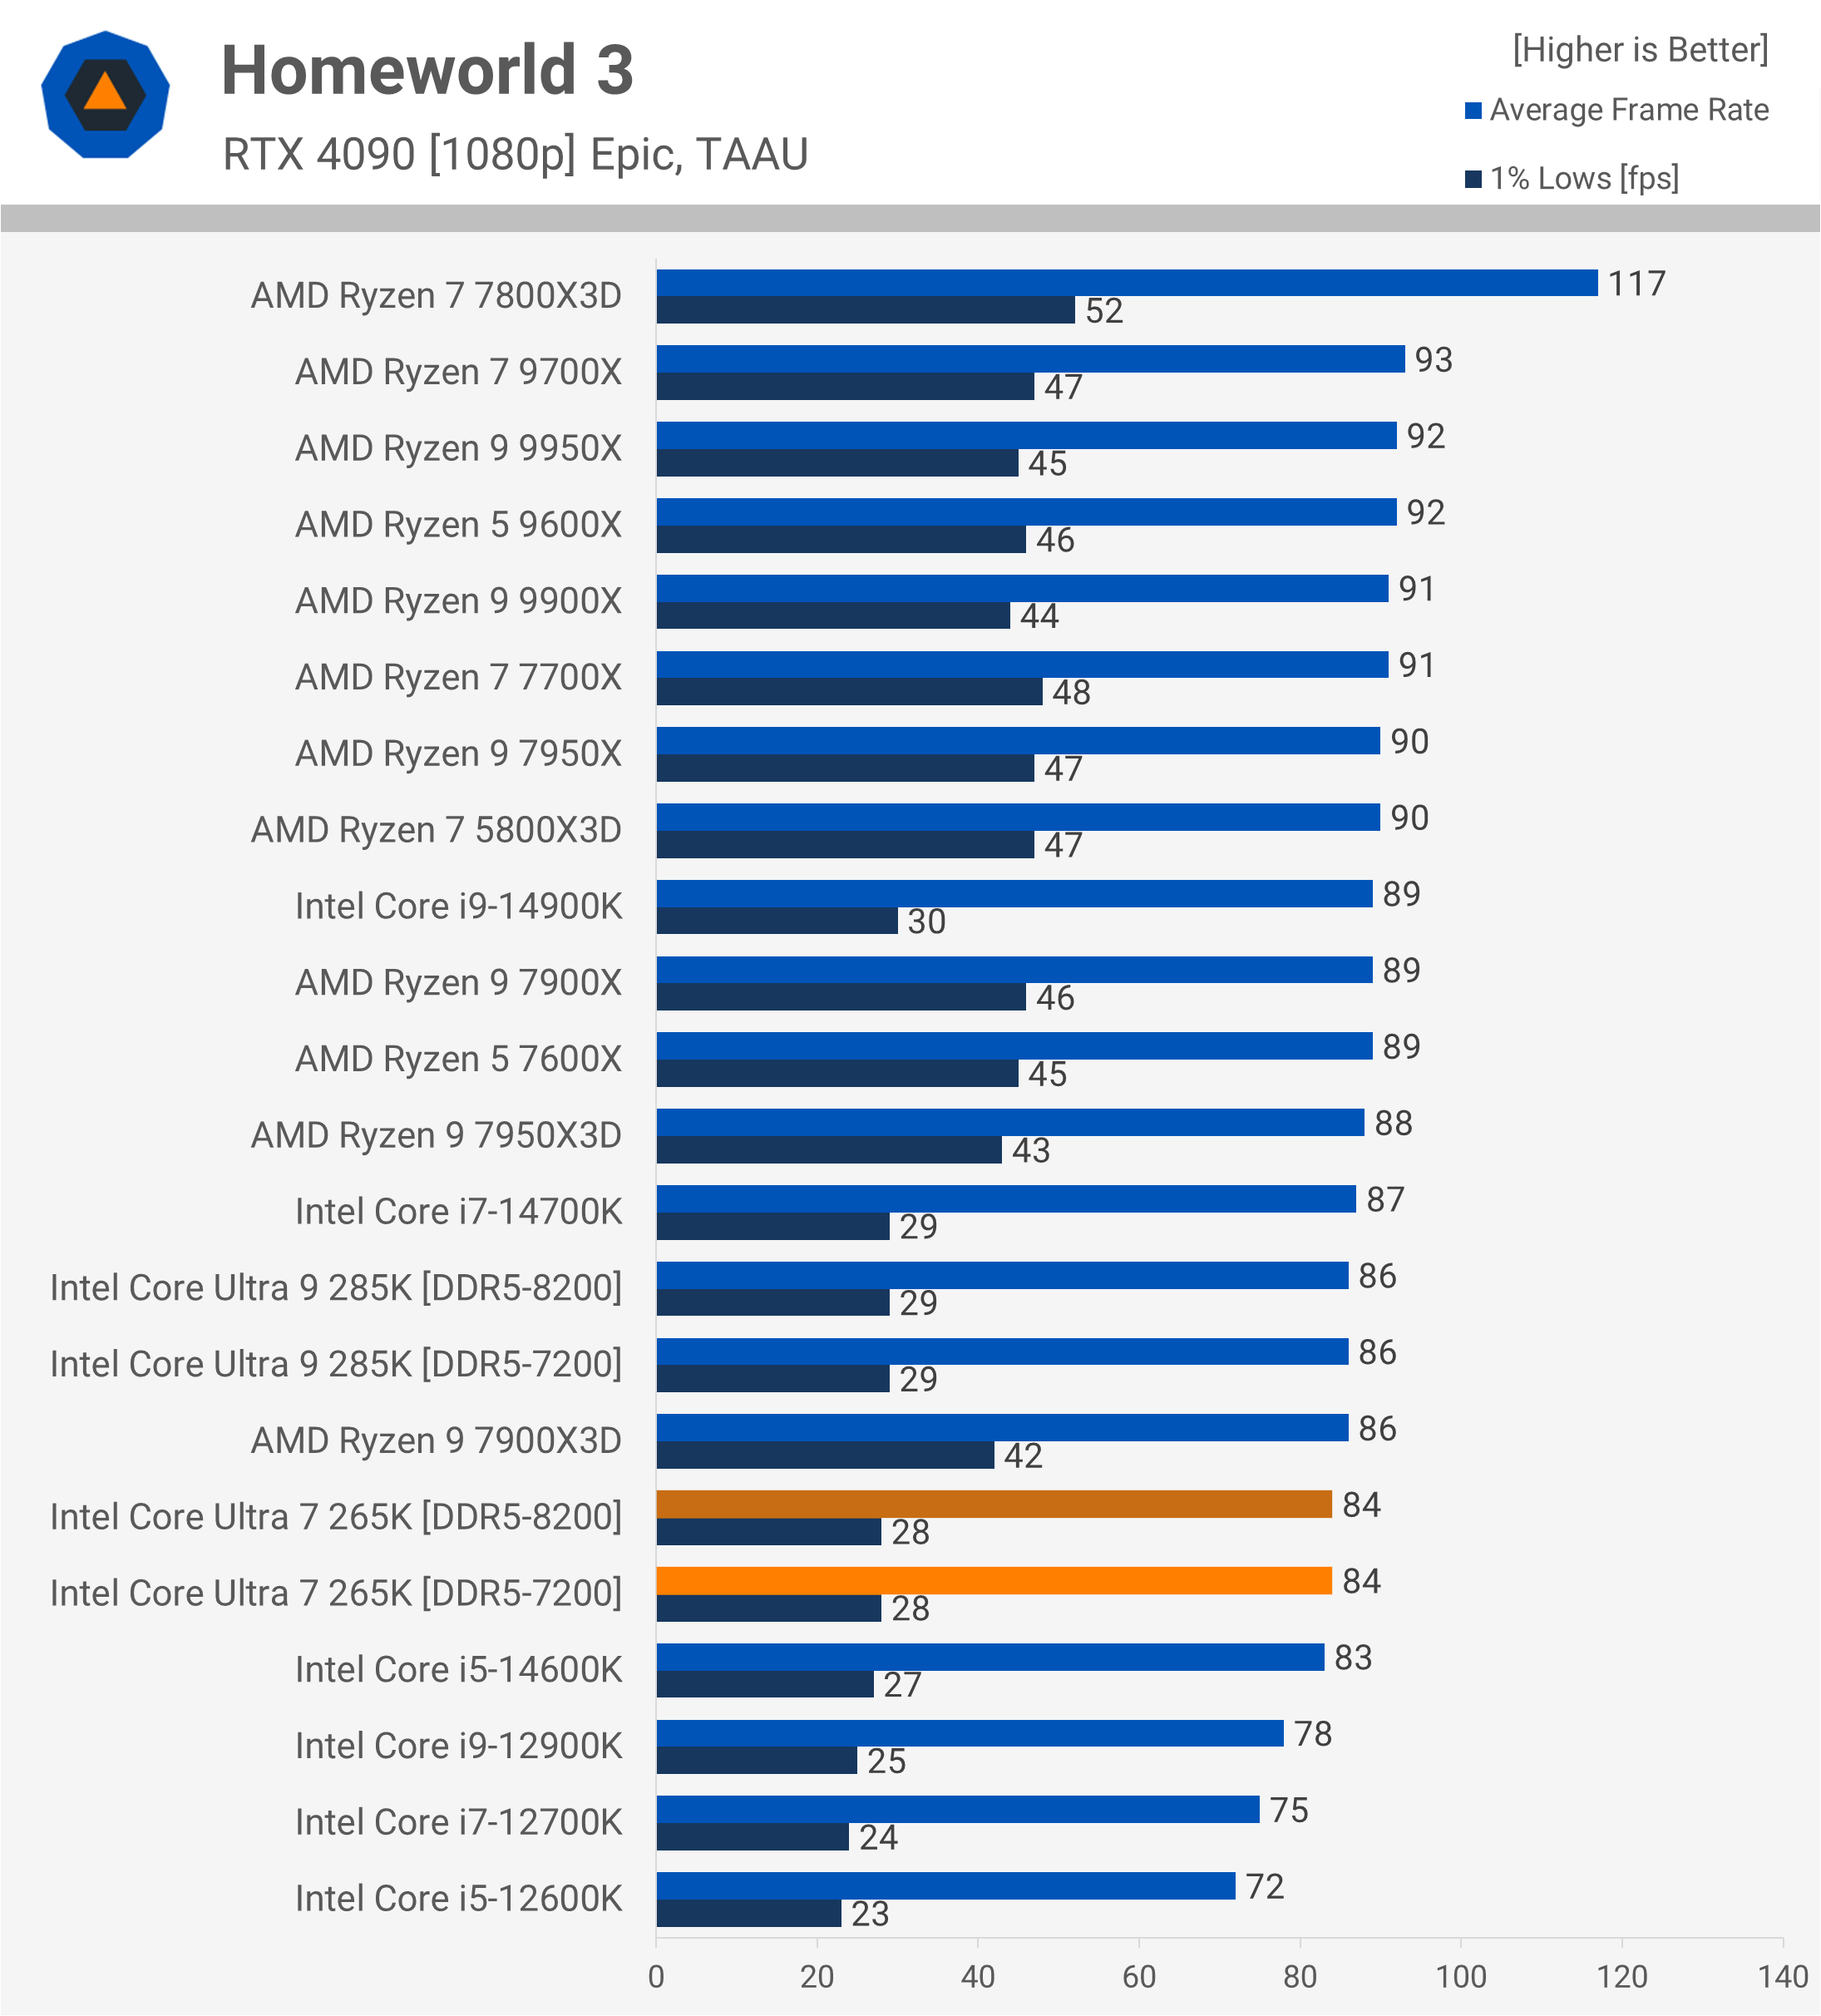
In Homeworld 3, updating the power plan from ‘balanced’ to ‘high performance’ helps significantly. Although we typically don’t adjust these settings for testing, we made an exception here, confident that Intel and Microsoft will address this issue quickly.
However, even with the manually adjusted power profile, the Arrow Lake CPUs underperform, with the 265K being 3% slower than the 14700K and 8% slower than the 9900X.
A Plague Tale: Requiem
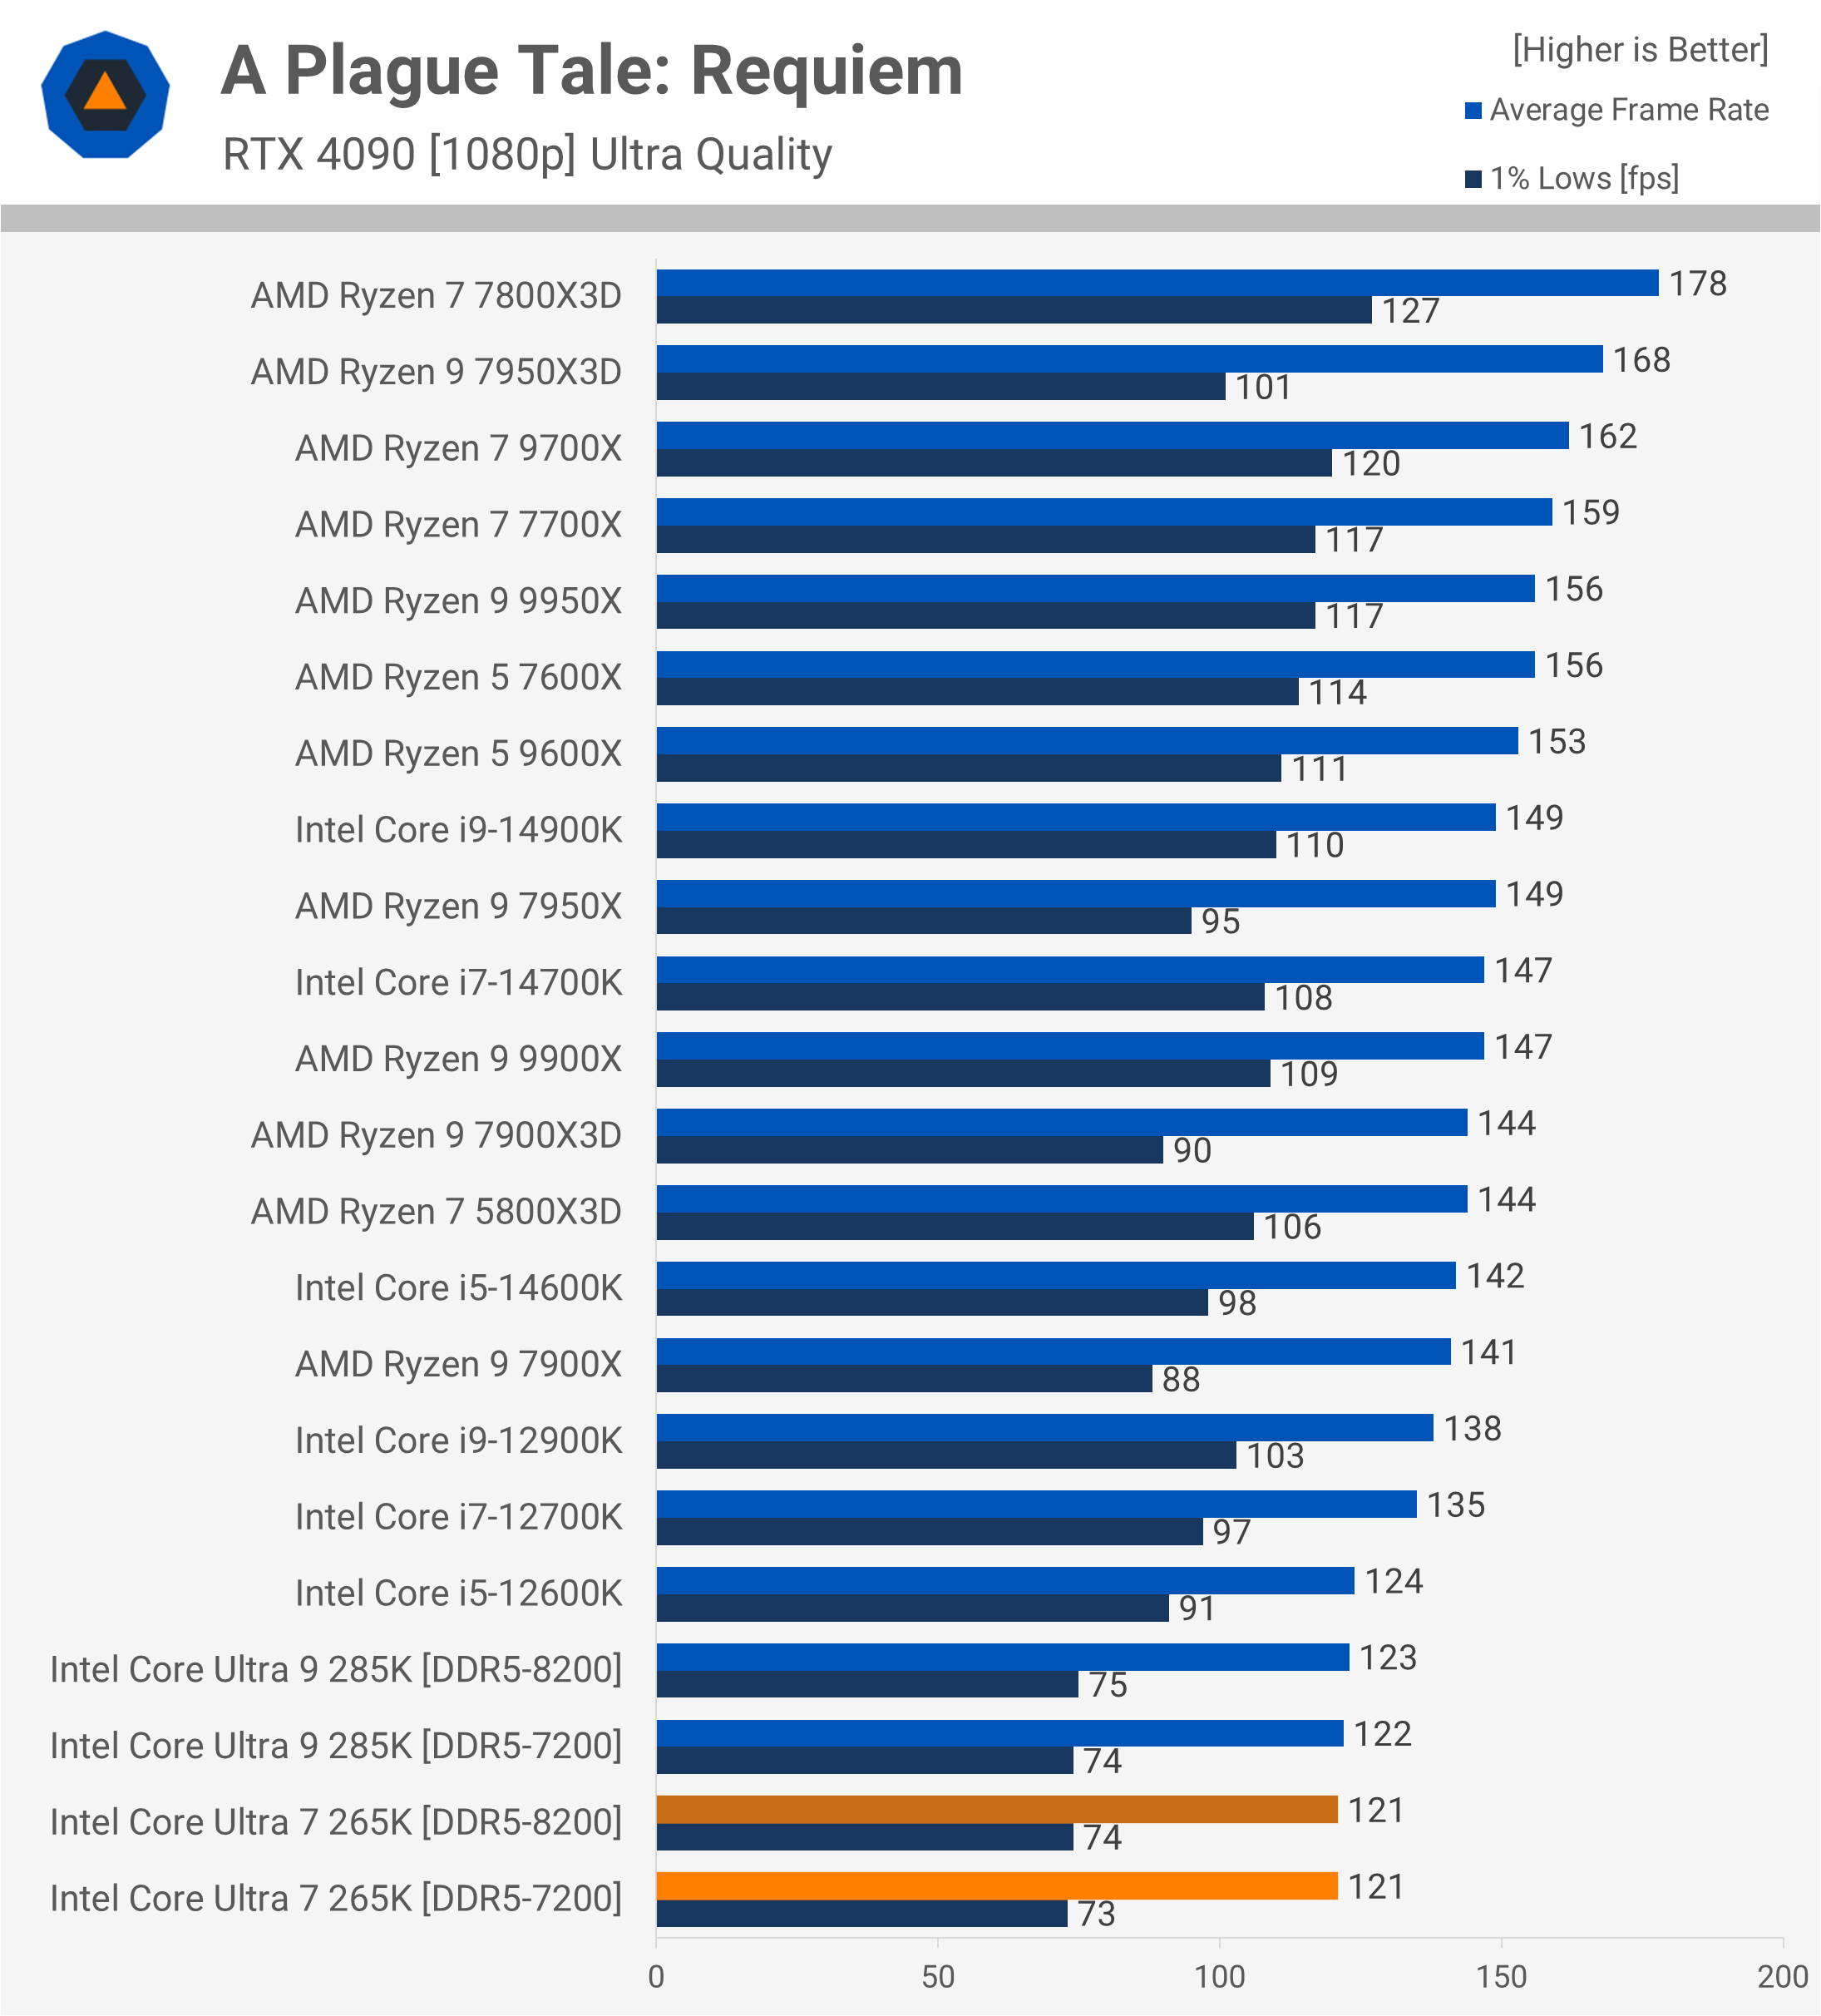
We’ve been unable to resolve the poor Arrow Lake performance in A Plague Tale: Requiem. The 265K mirrors the poor showing of the 285K, trailing the 14700K by an 18% margin.
Counter-Strike 2
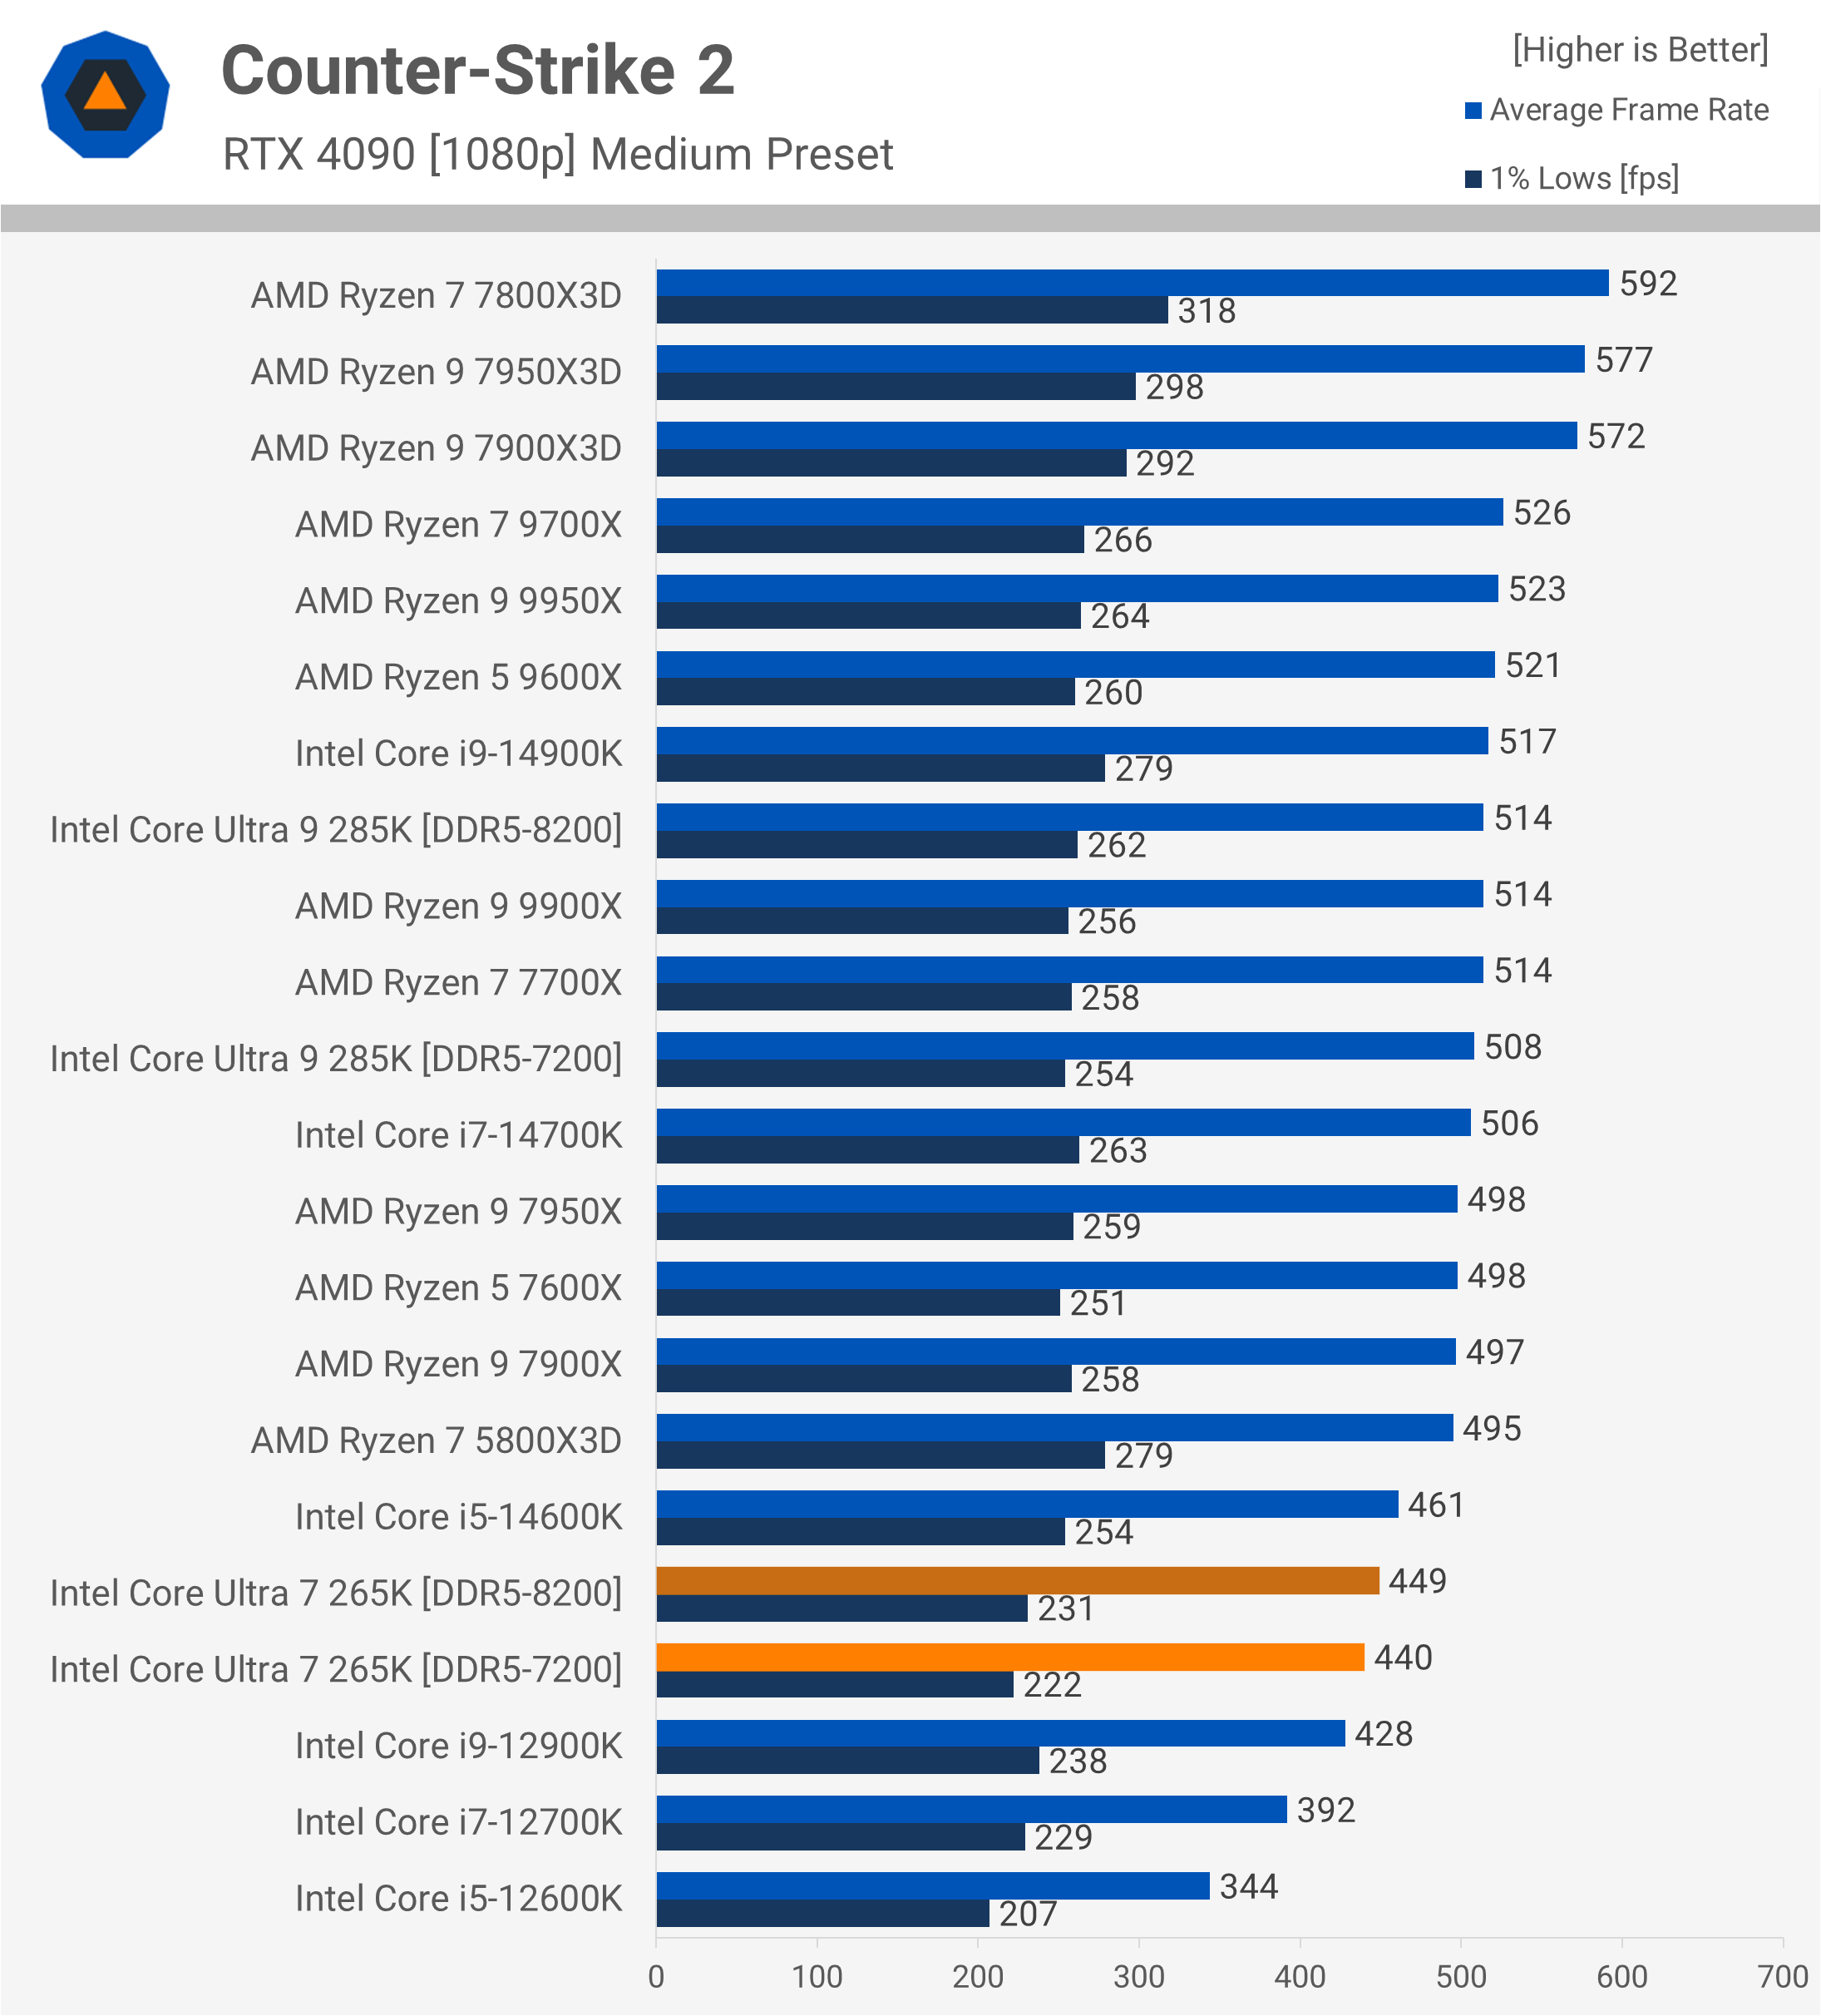
The 265K also shows weak performance in Counter-Strike 2, lagging behind even the 14600K and ending up 13% slower than the 14700K when using the same DDR5-7200 memory.
Starfield
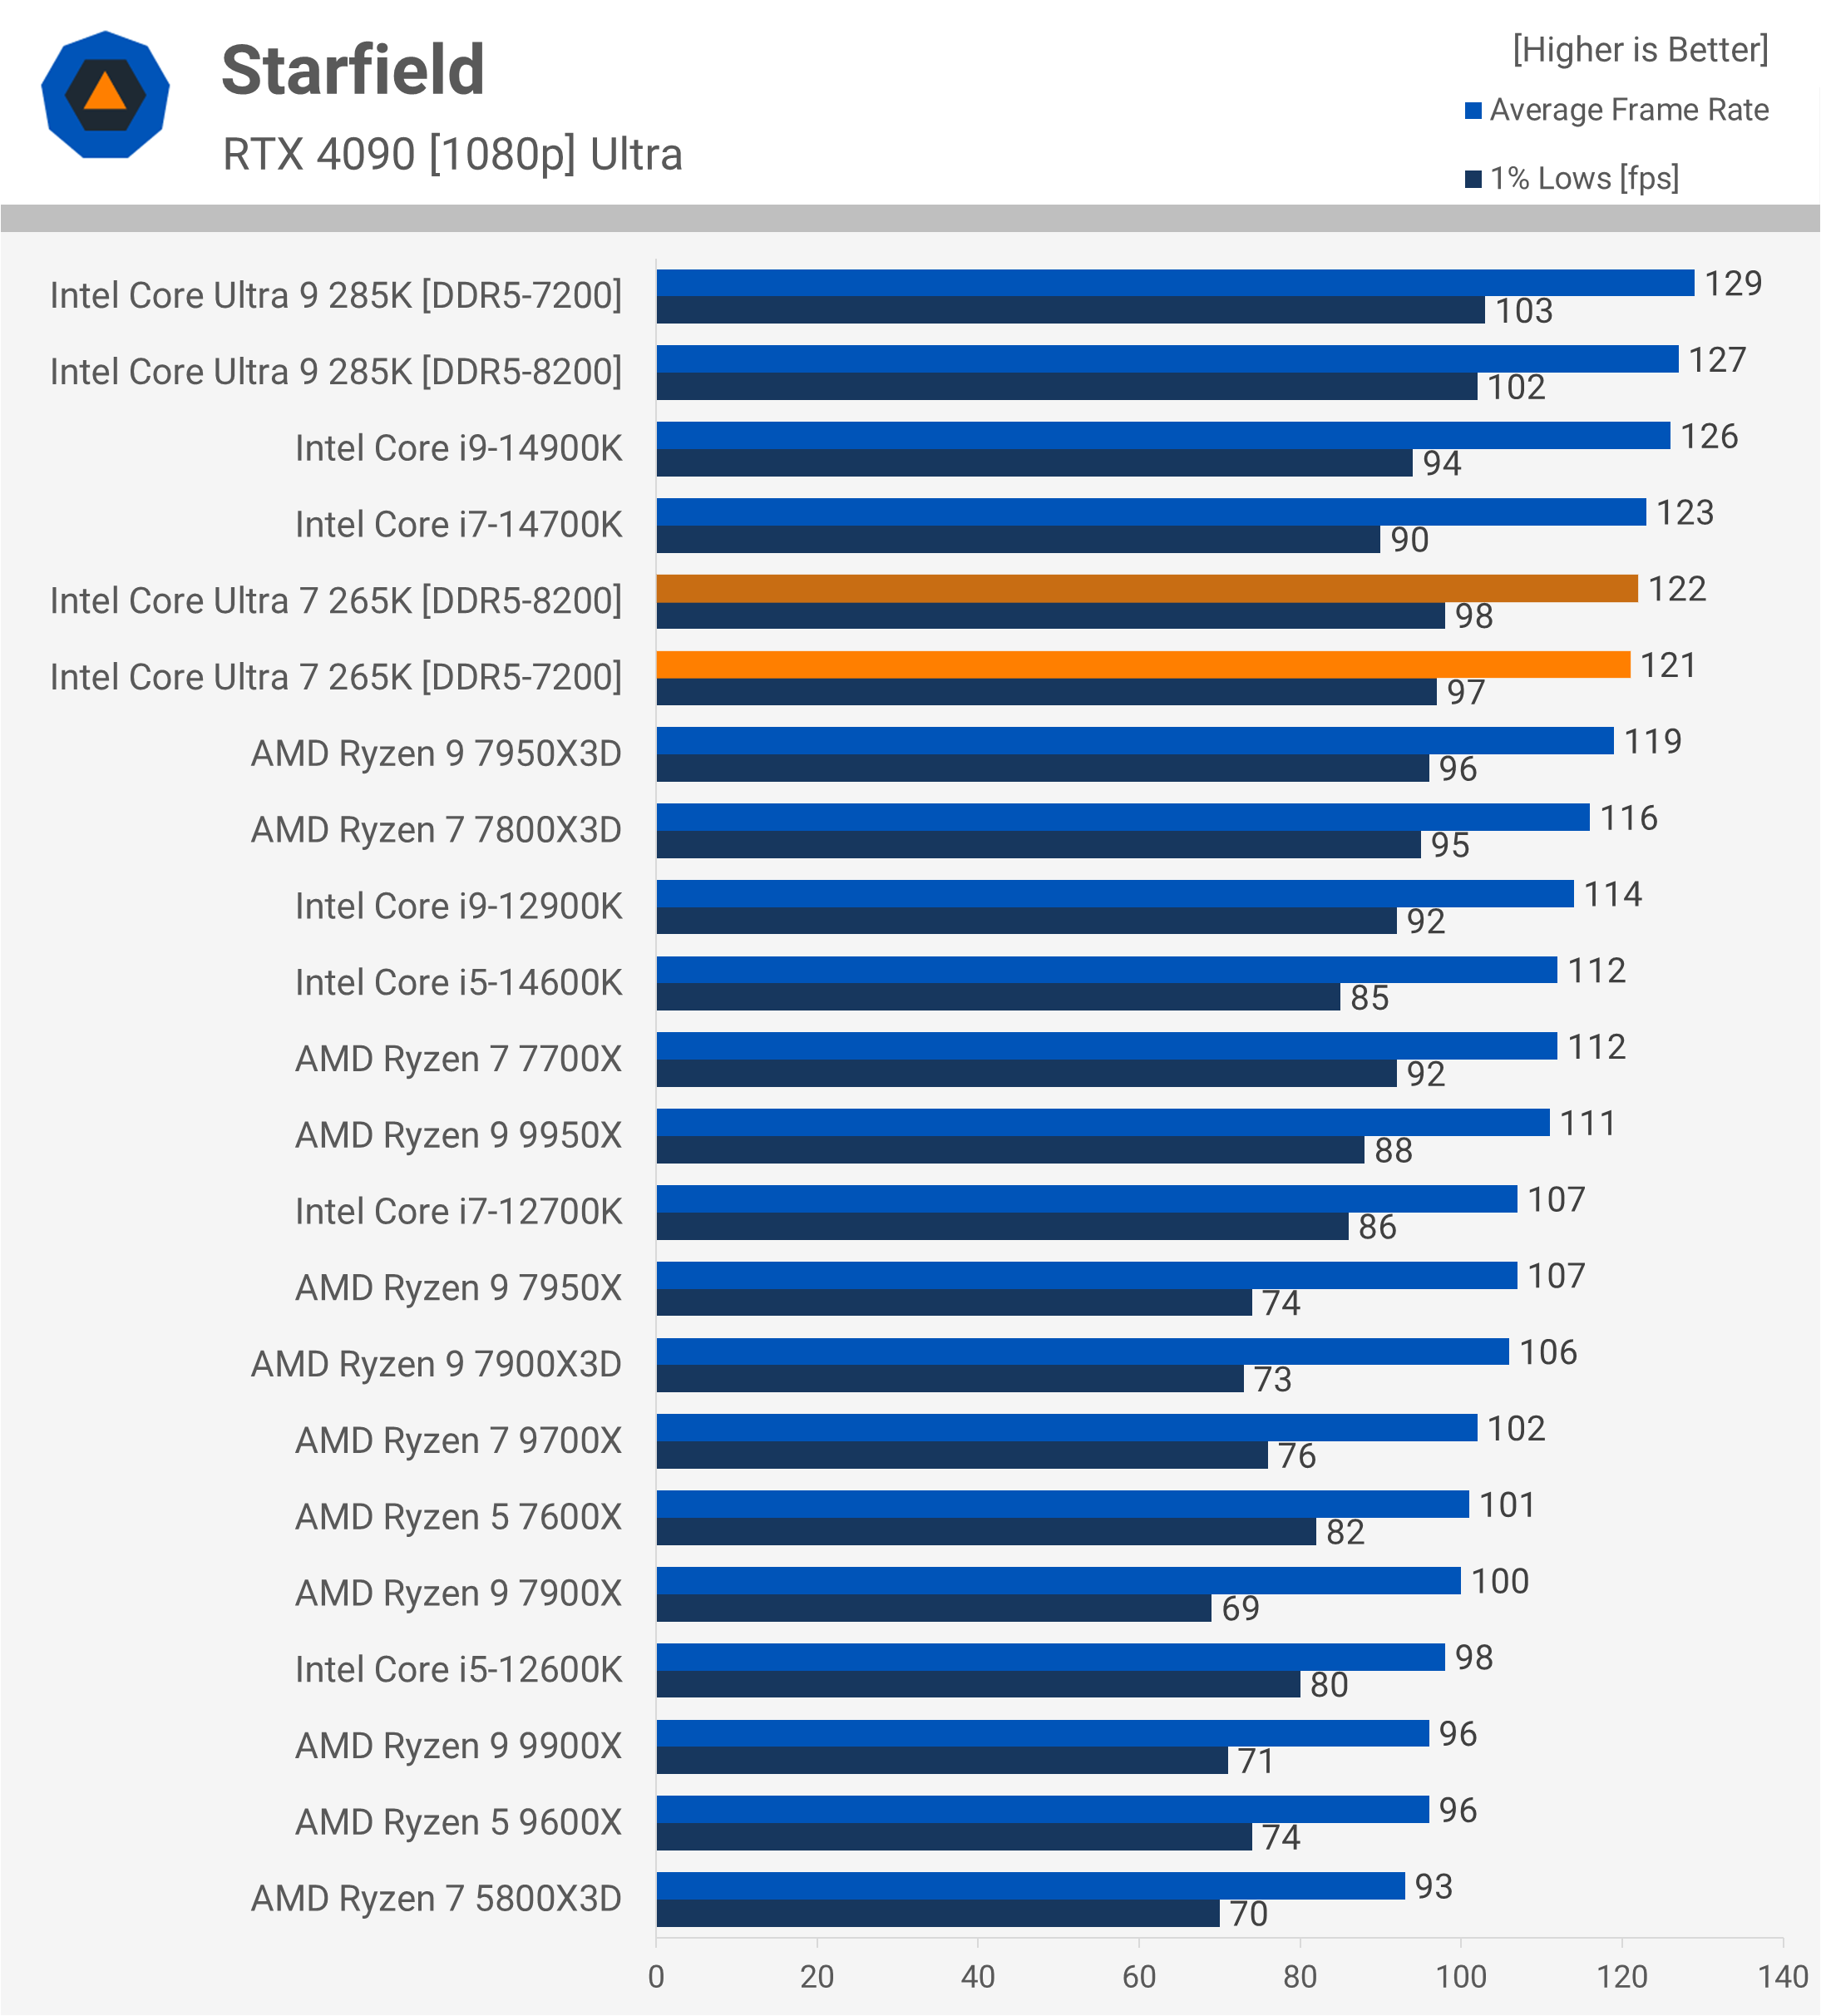
Starfield provides a more positive showing for the 285K, and we find similar results for the 265K. Although it couldn’t surpass the outgoing 14700K, Intel’s performance here is strong when compared to the Zen 5 processors.
Warhammer 40,000: Space Marine 2
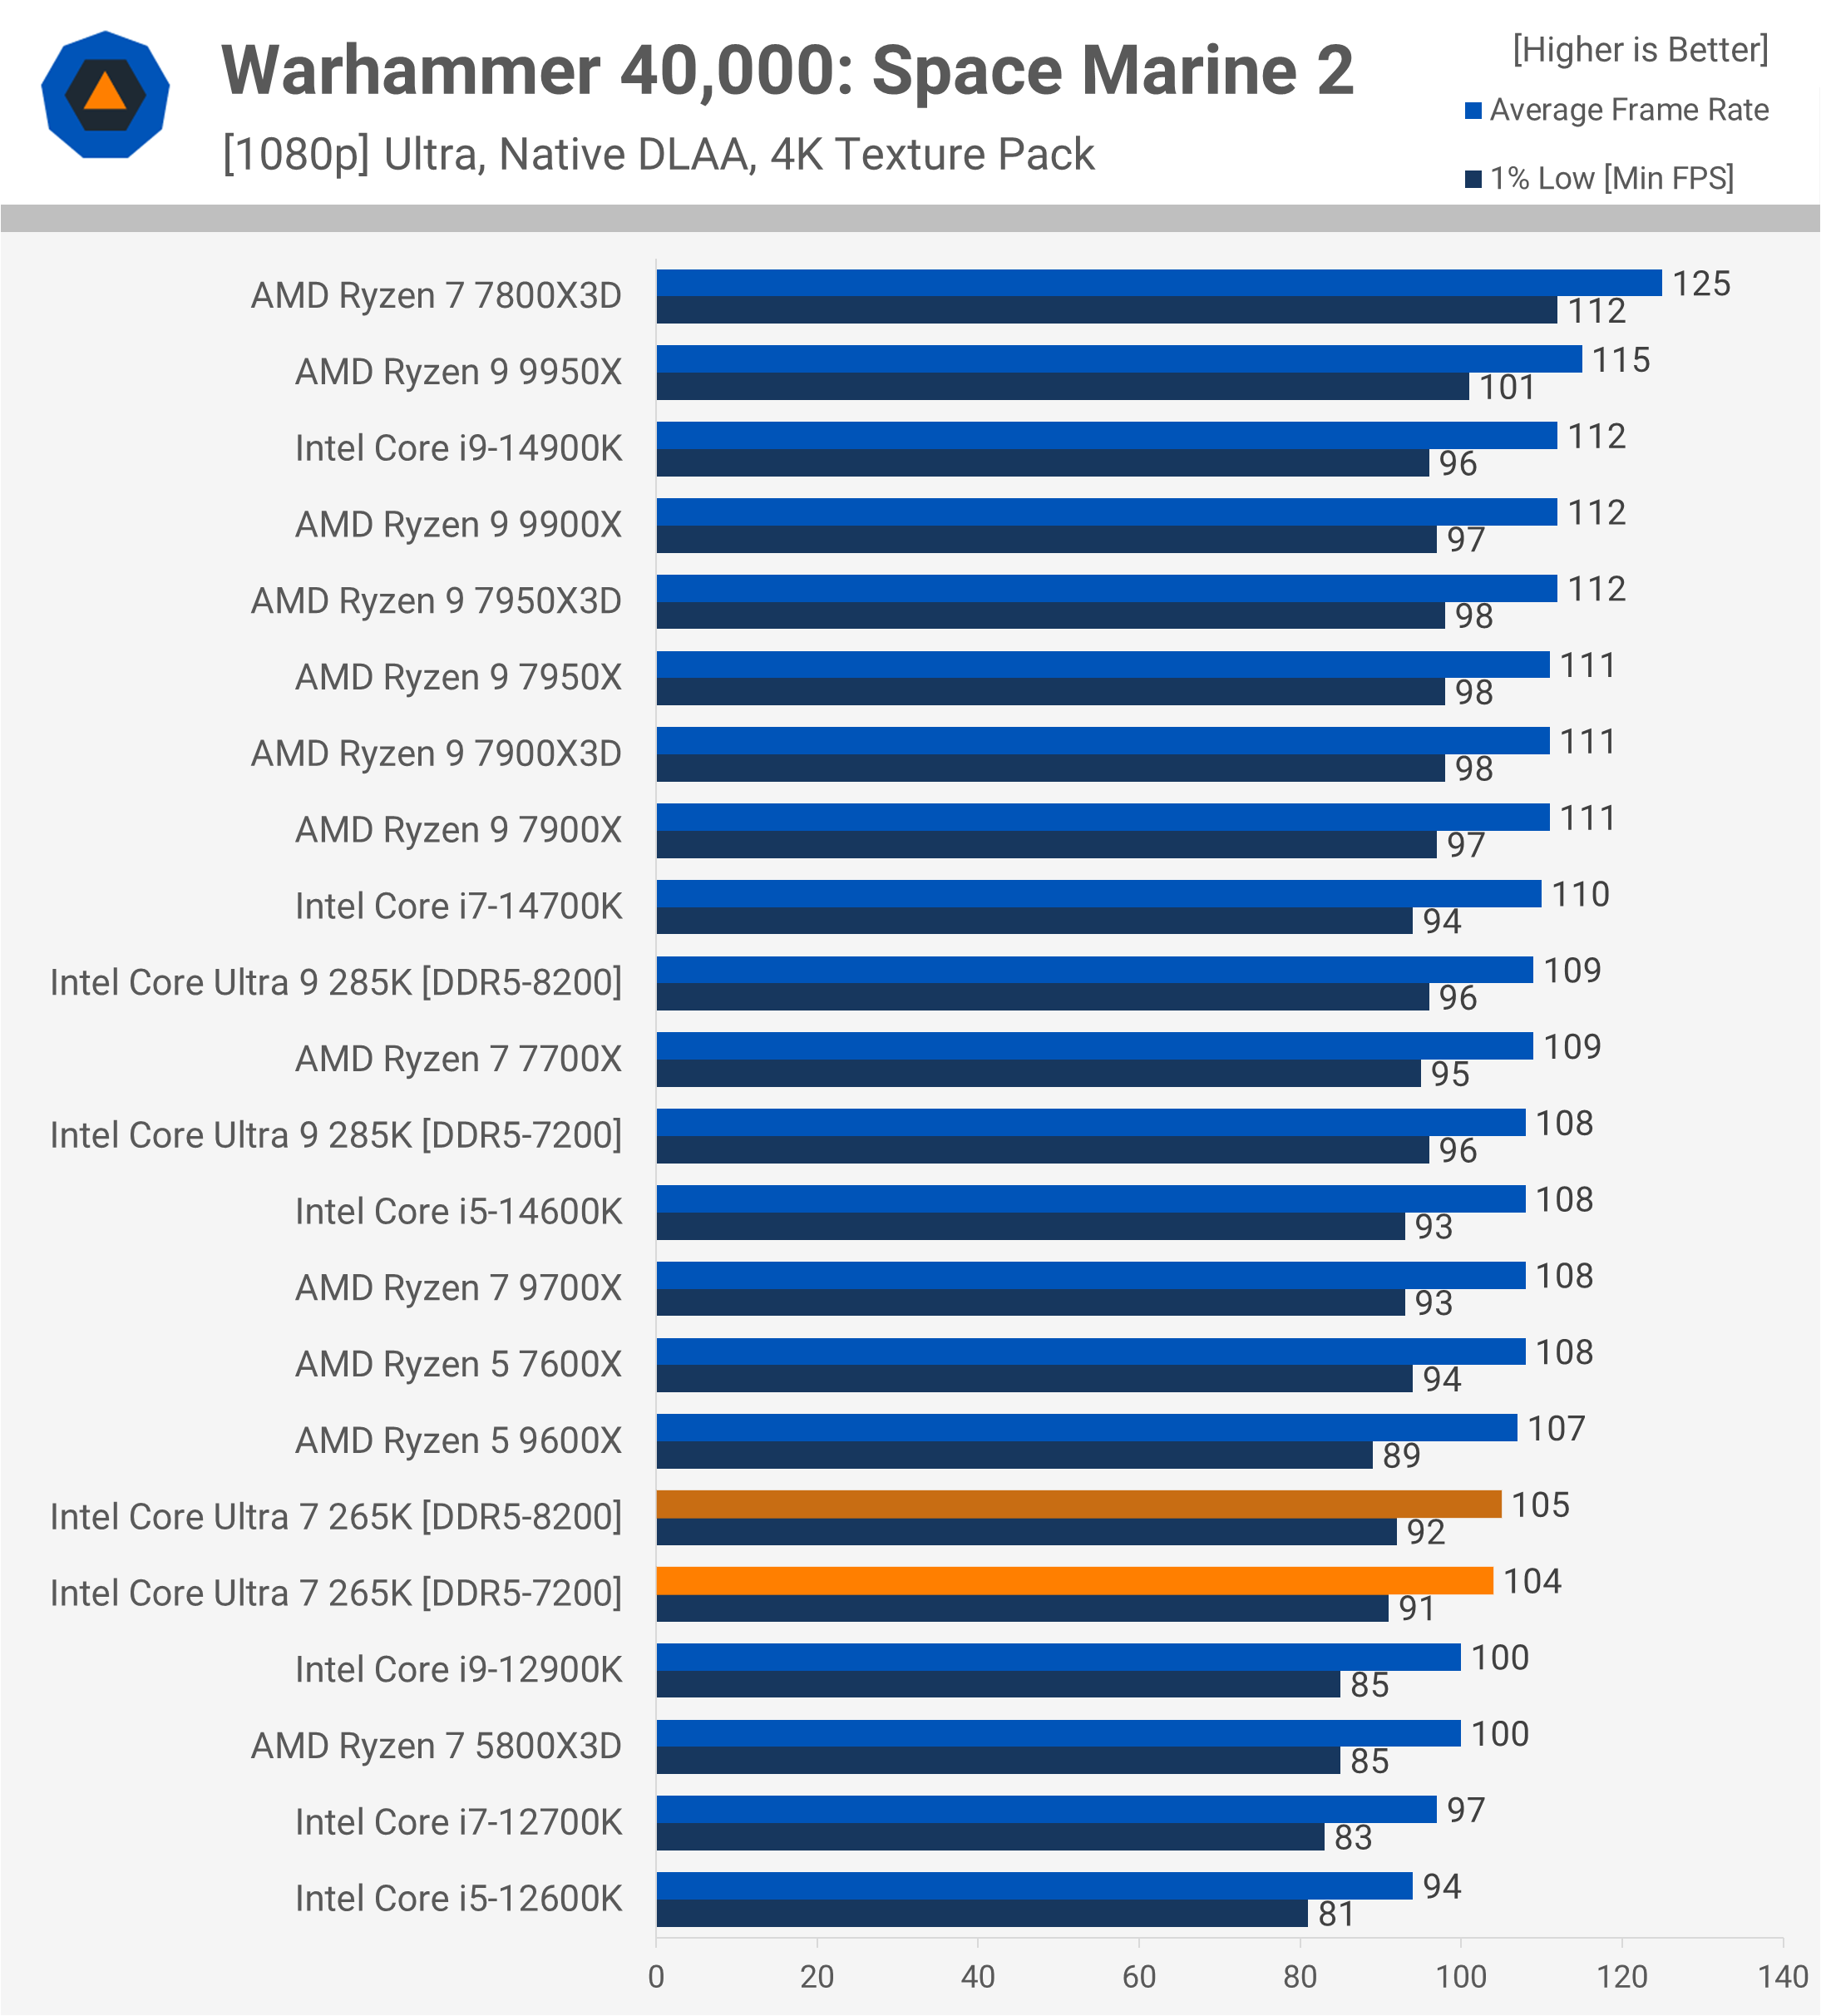
In Warhammer 40,000: Space Marine 2, the 265K disappoints, lagging 5% behind the 14700K and falling behind all competing AMD processors.
Hitman 3
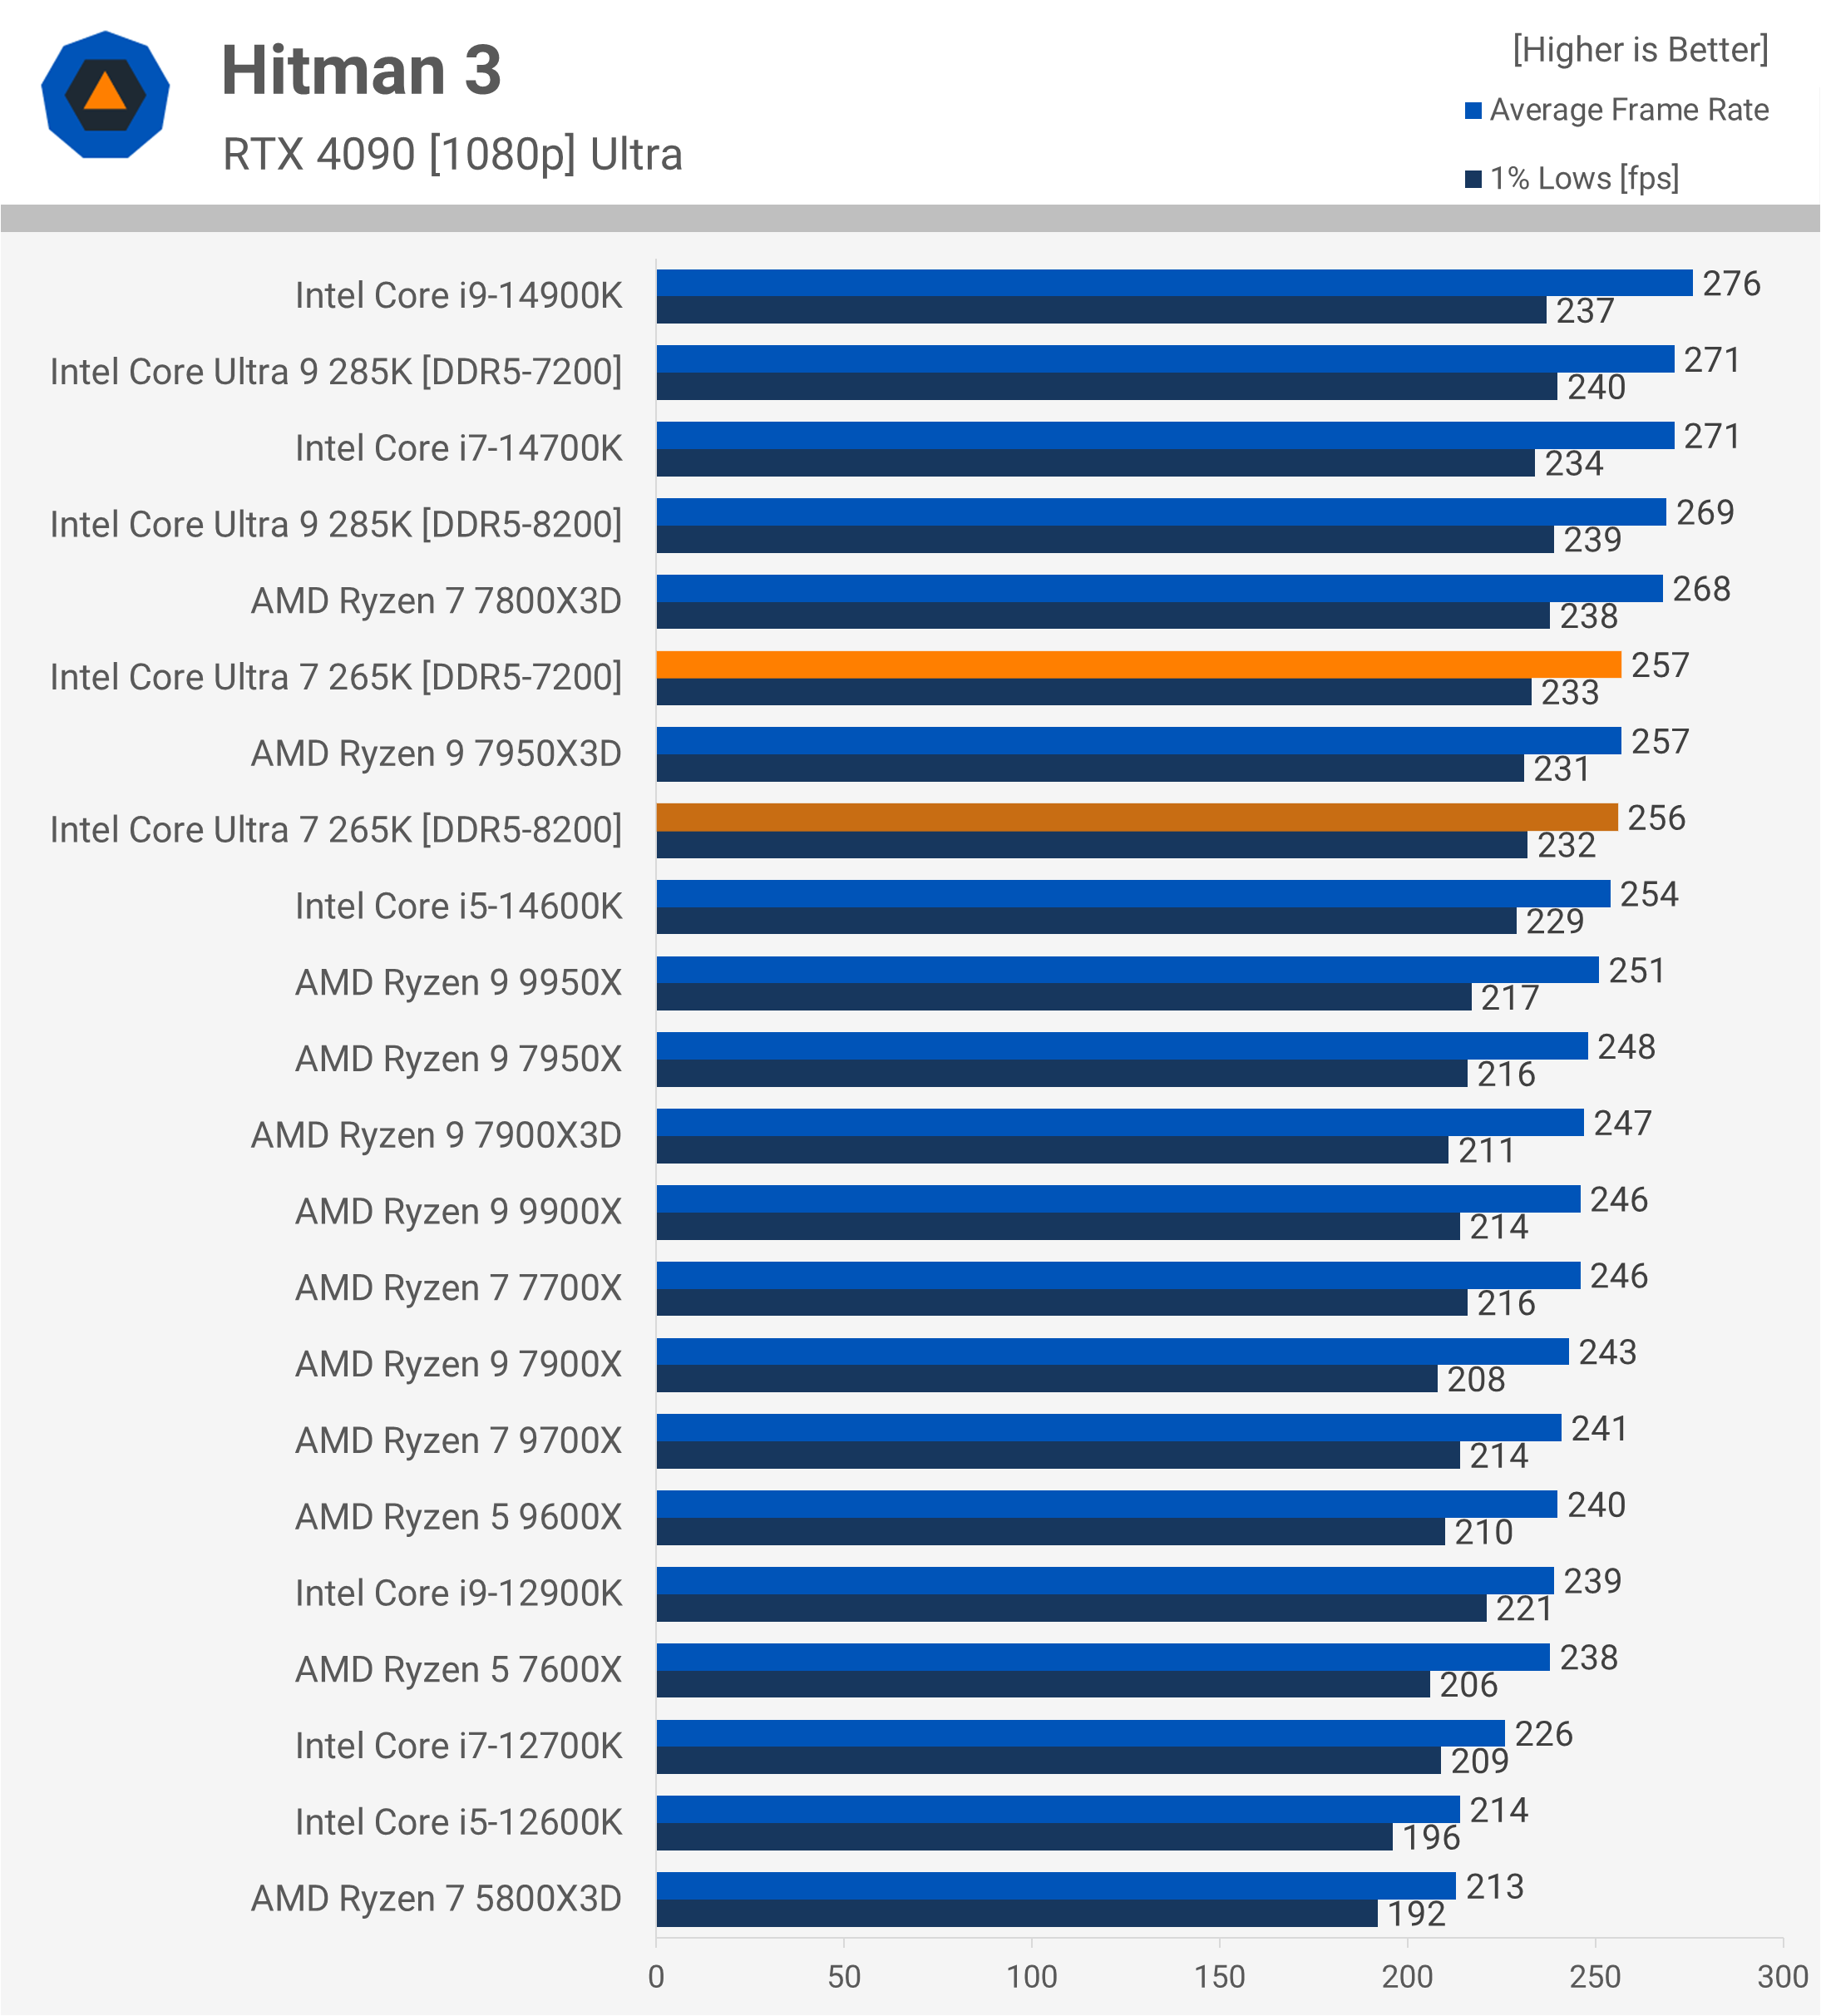
In Hitman 3, the 265K performs well relative to the 9700X and 9900X, yet it remains 5% slower than the 14700K, yielding an overall disappointing result.
Watch Dogs: Legion
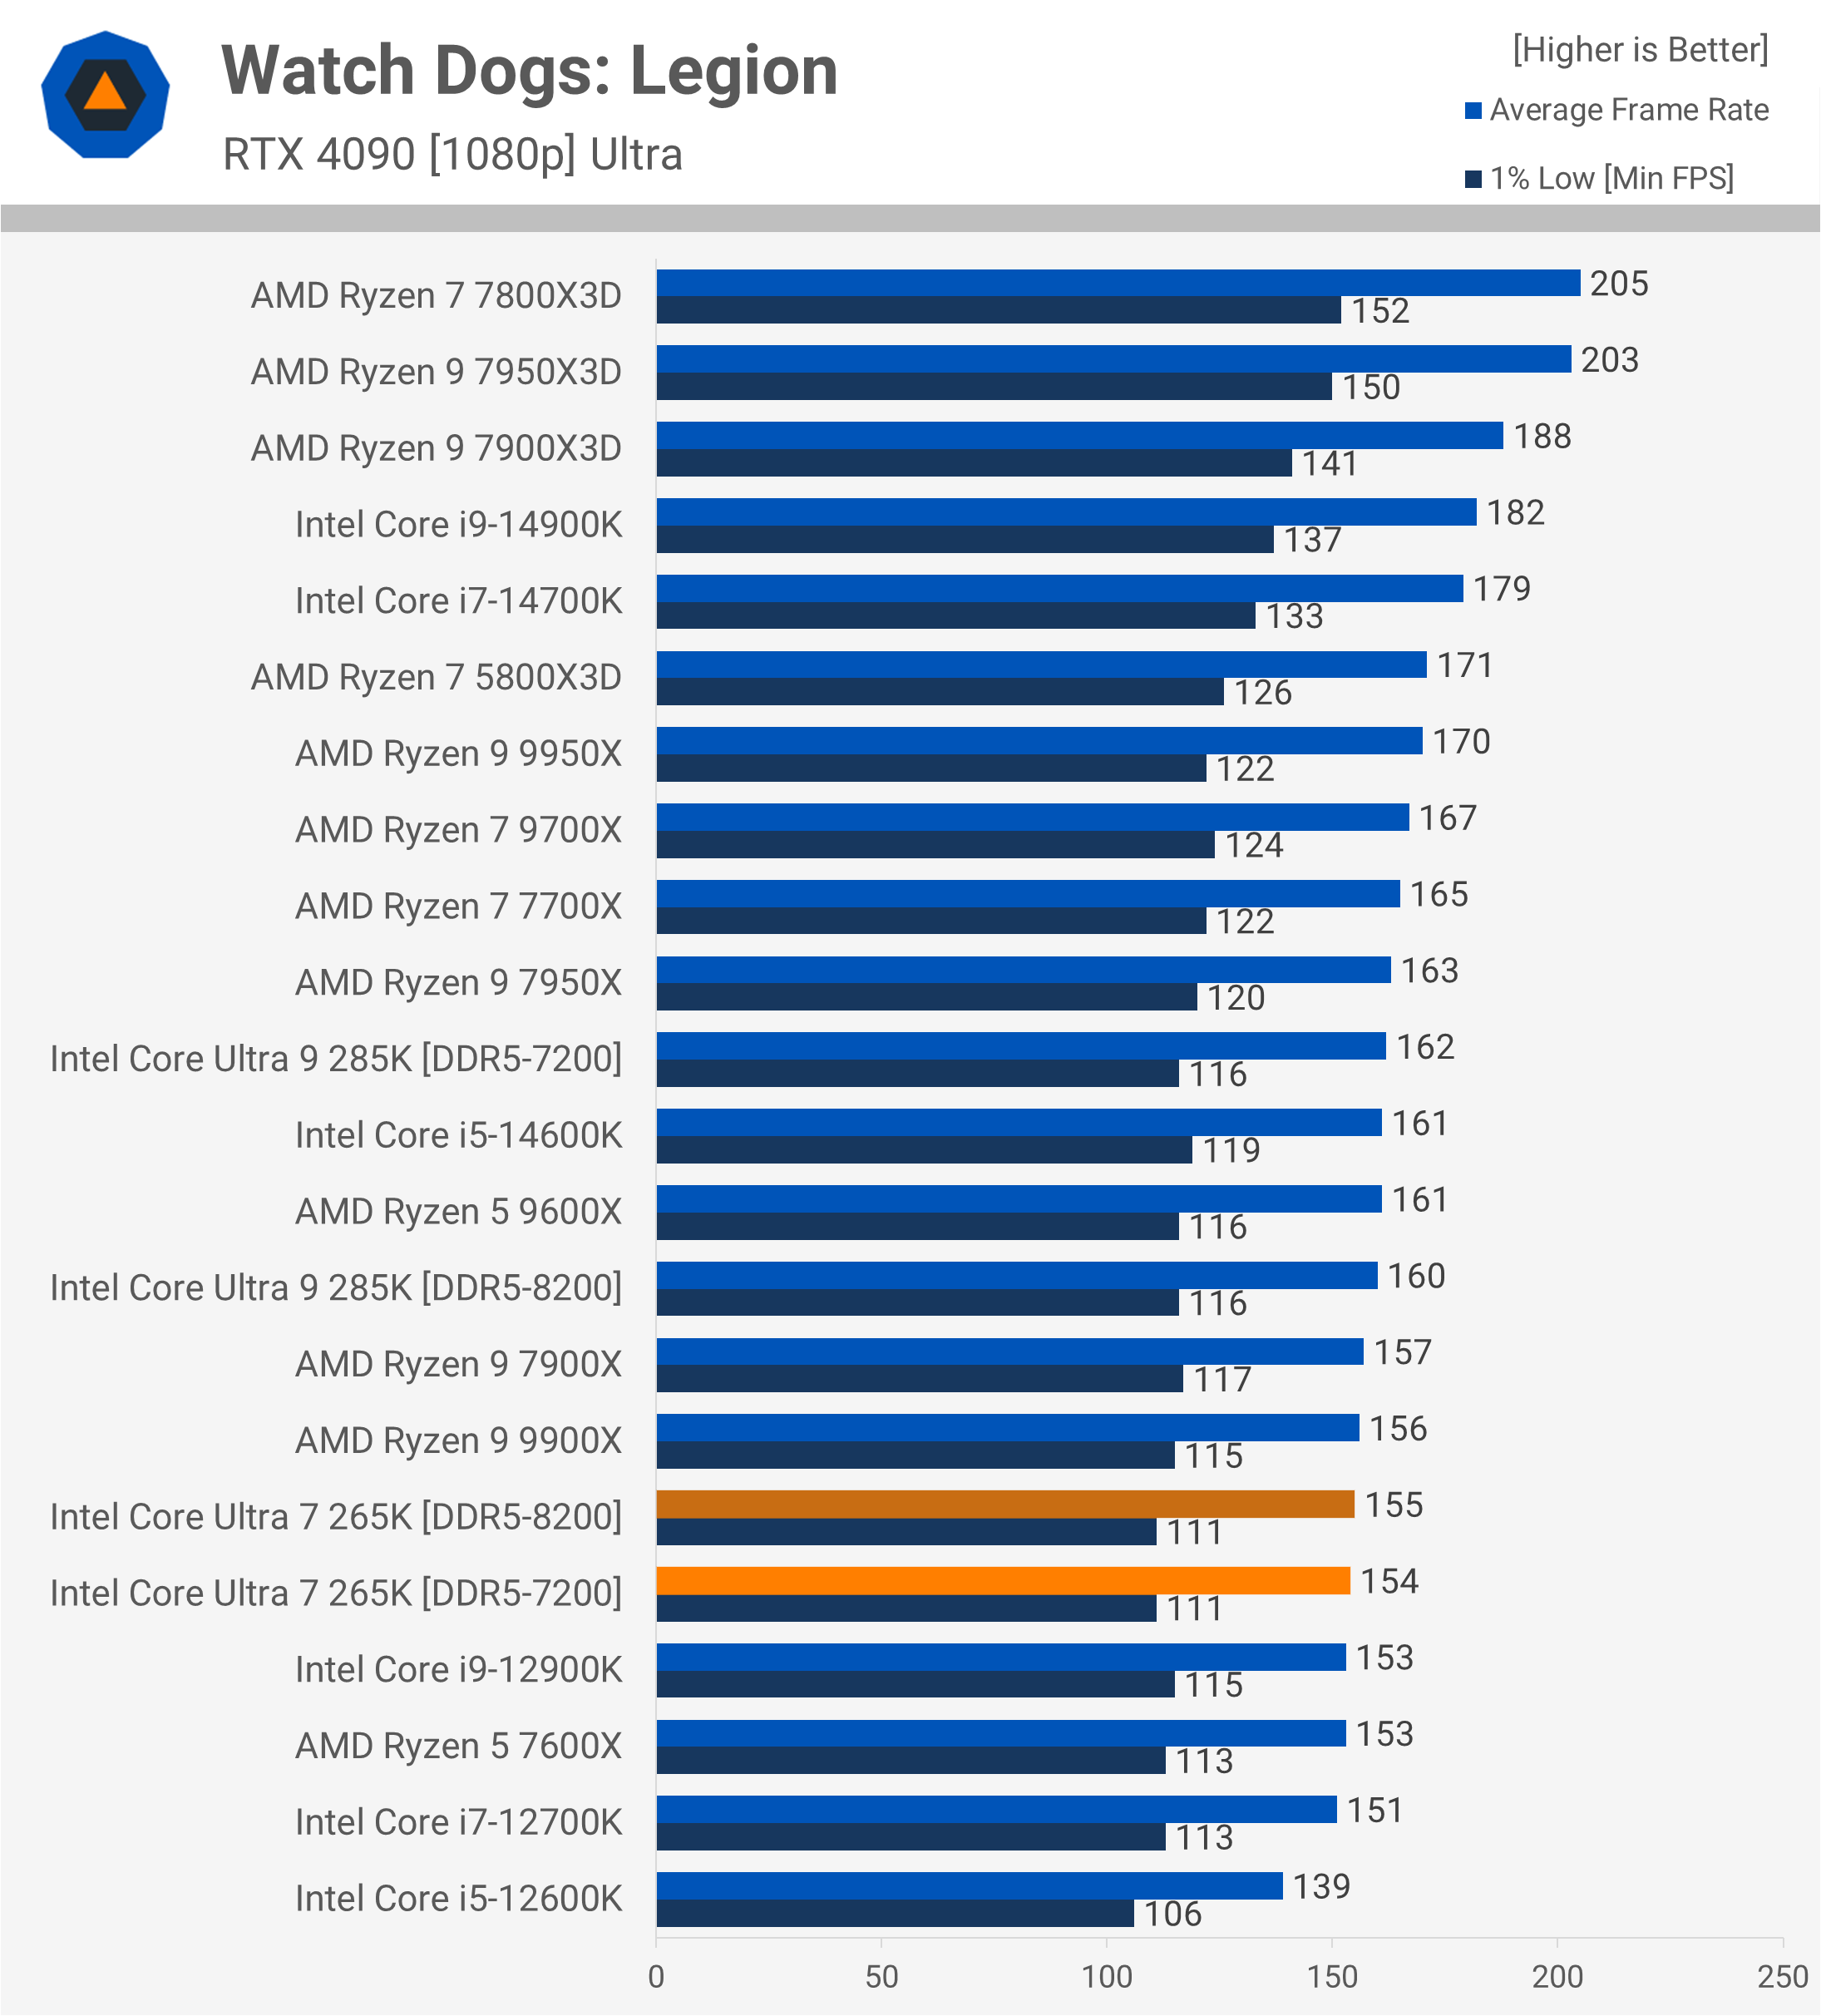
Performance in Watch Dogs: Legion is weak, with the 265K matching the 9900X but trailing both the 9700X and the 14700K by 14%.
Star Wars Outlaws
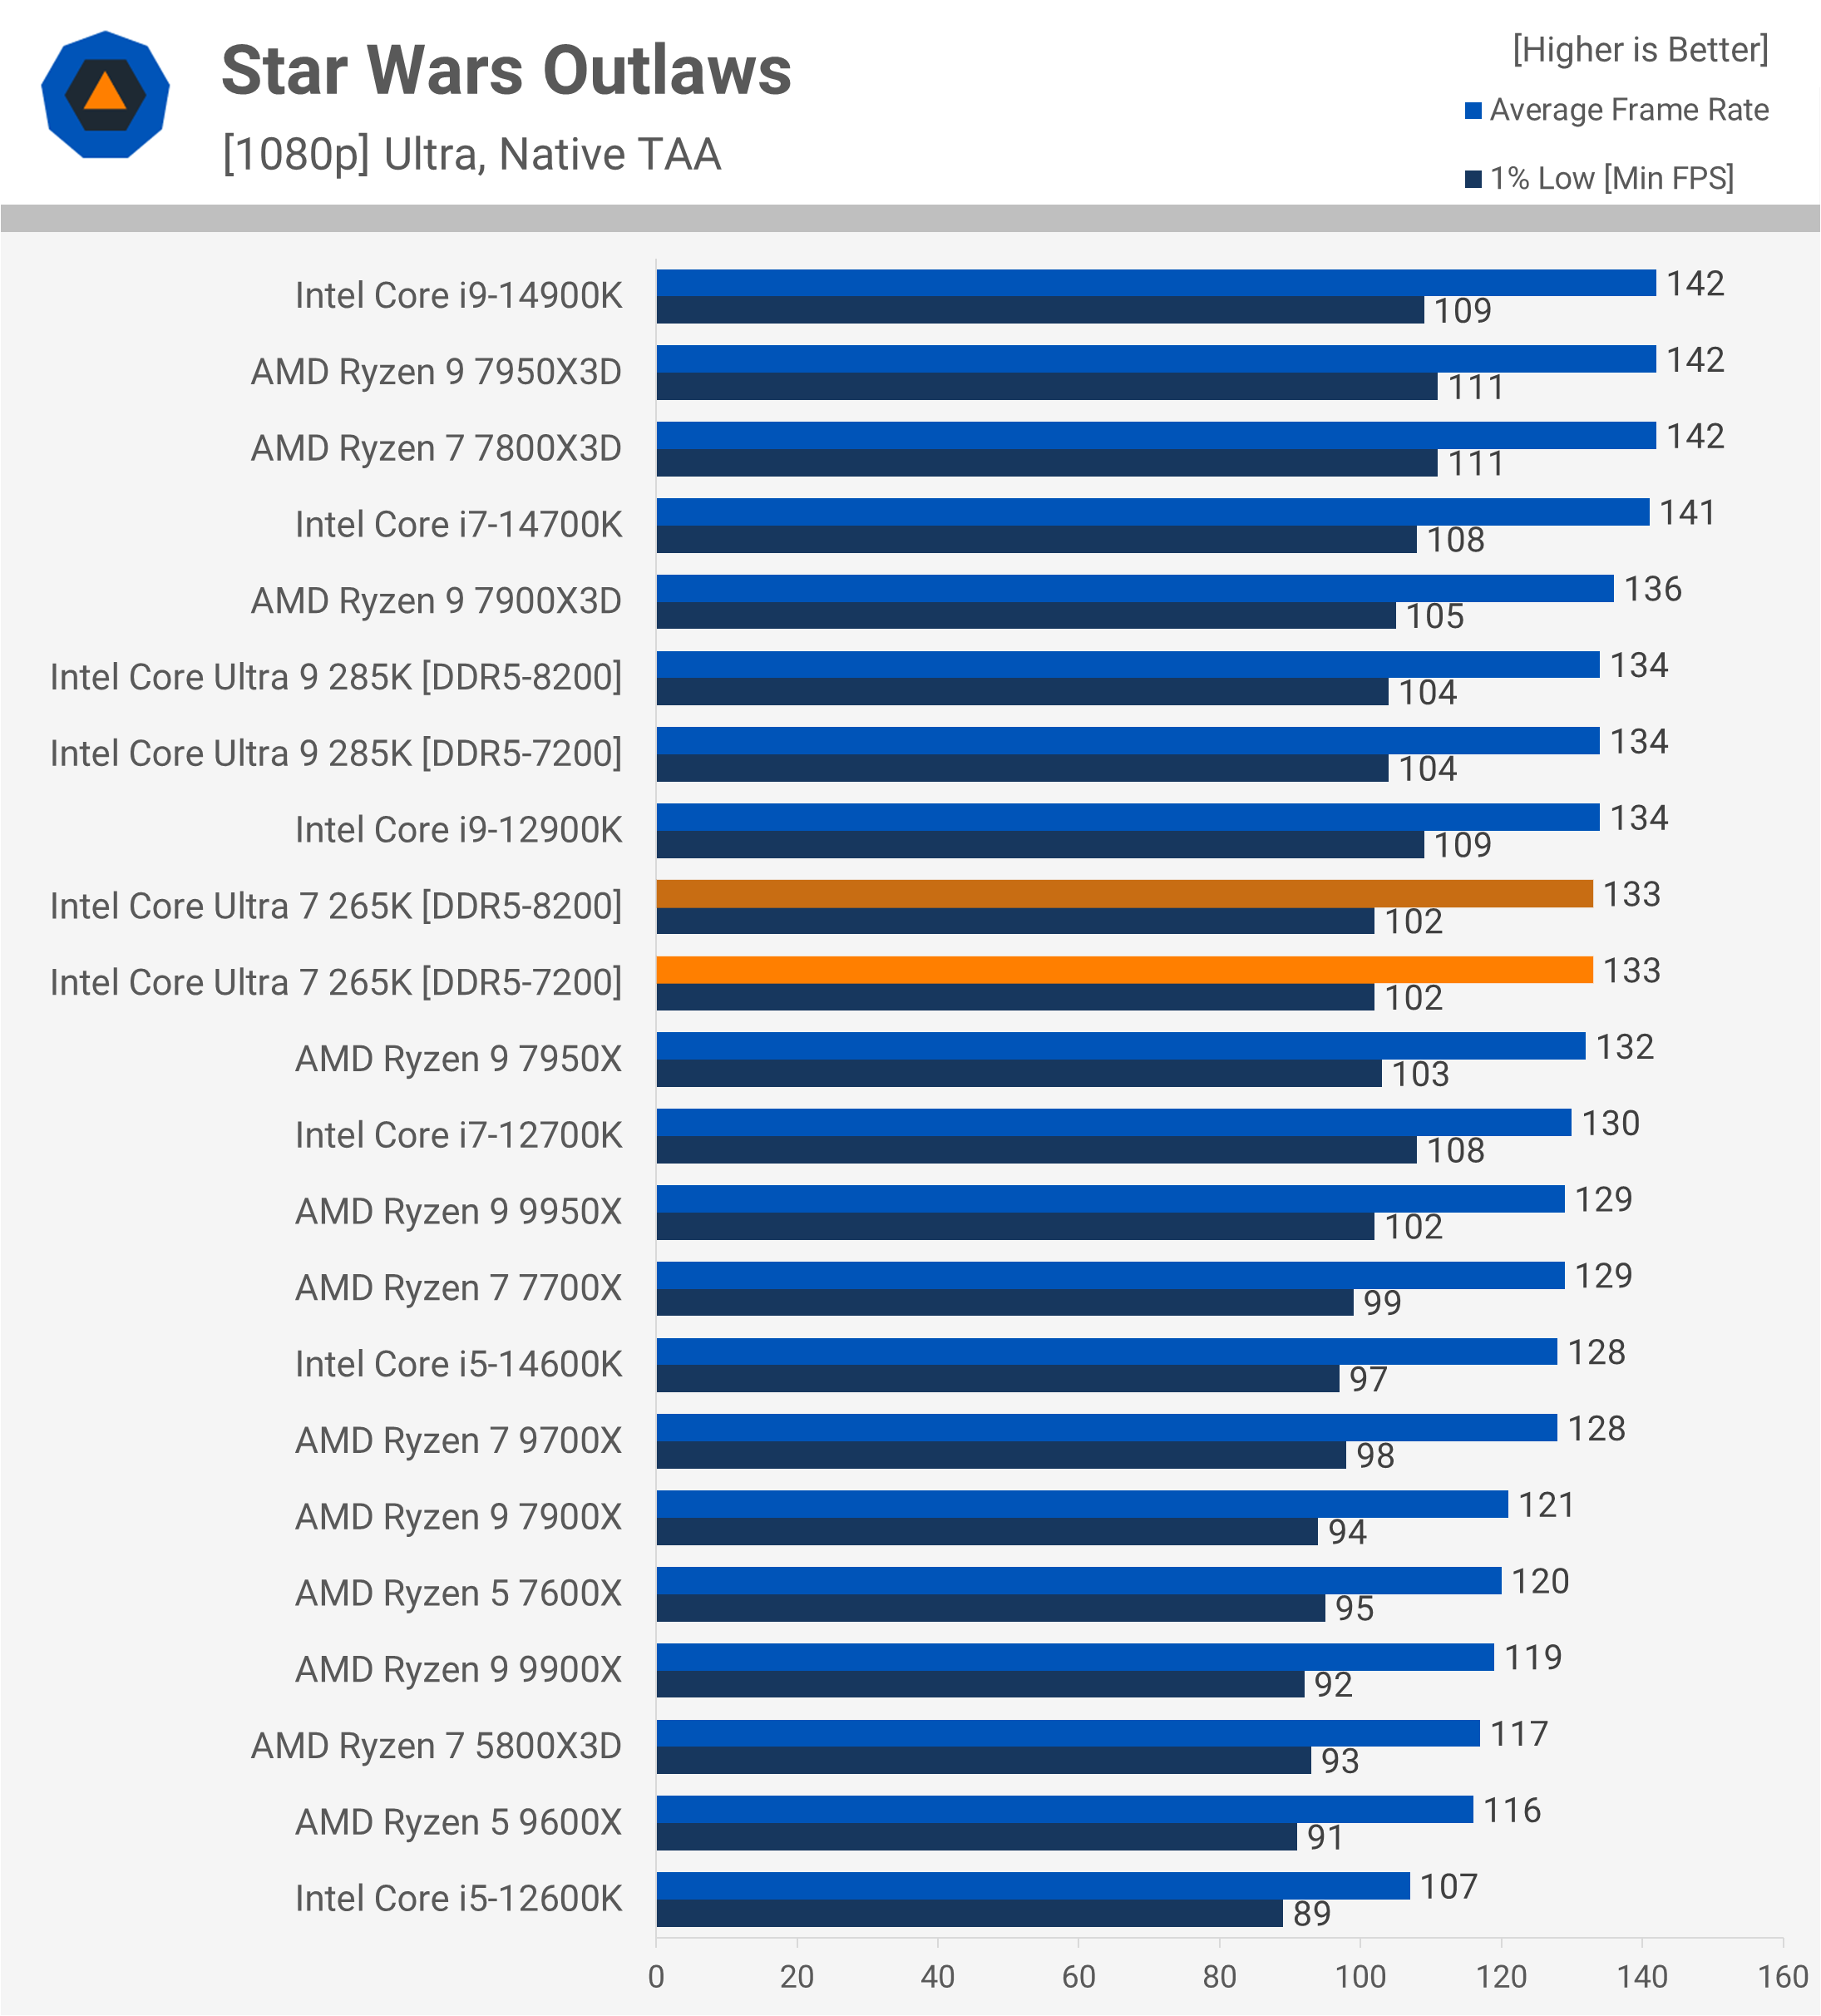
Finally, in Star Wars Outlaws, the 265K trails the 14700K by 6% but outperforms both the 9700X and 9900X.
Gaming Power Consumption
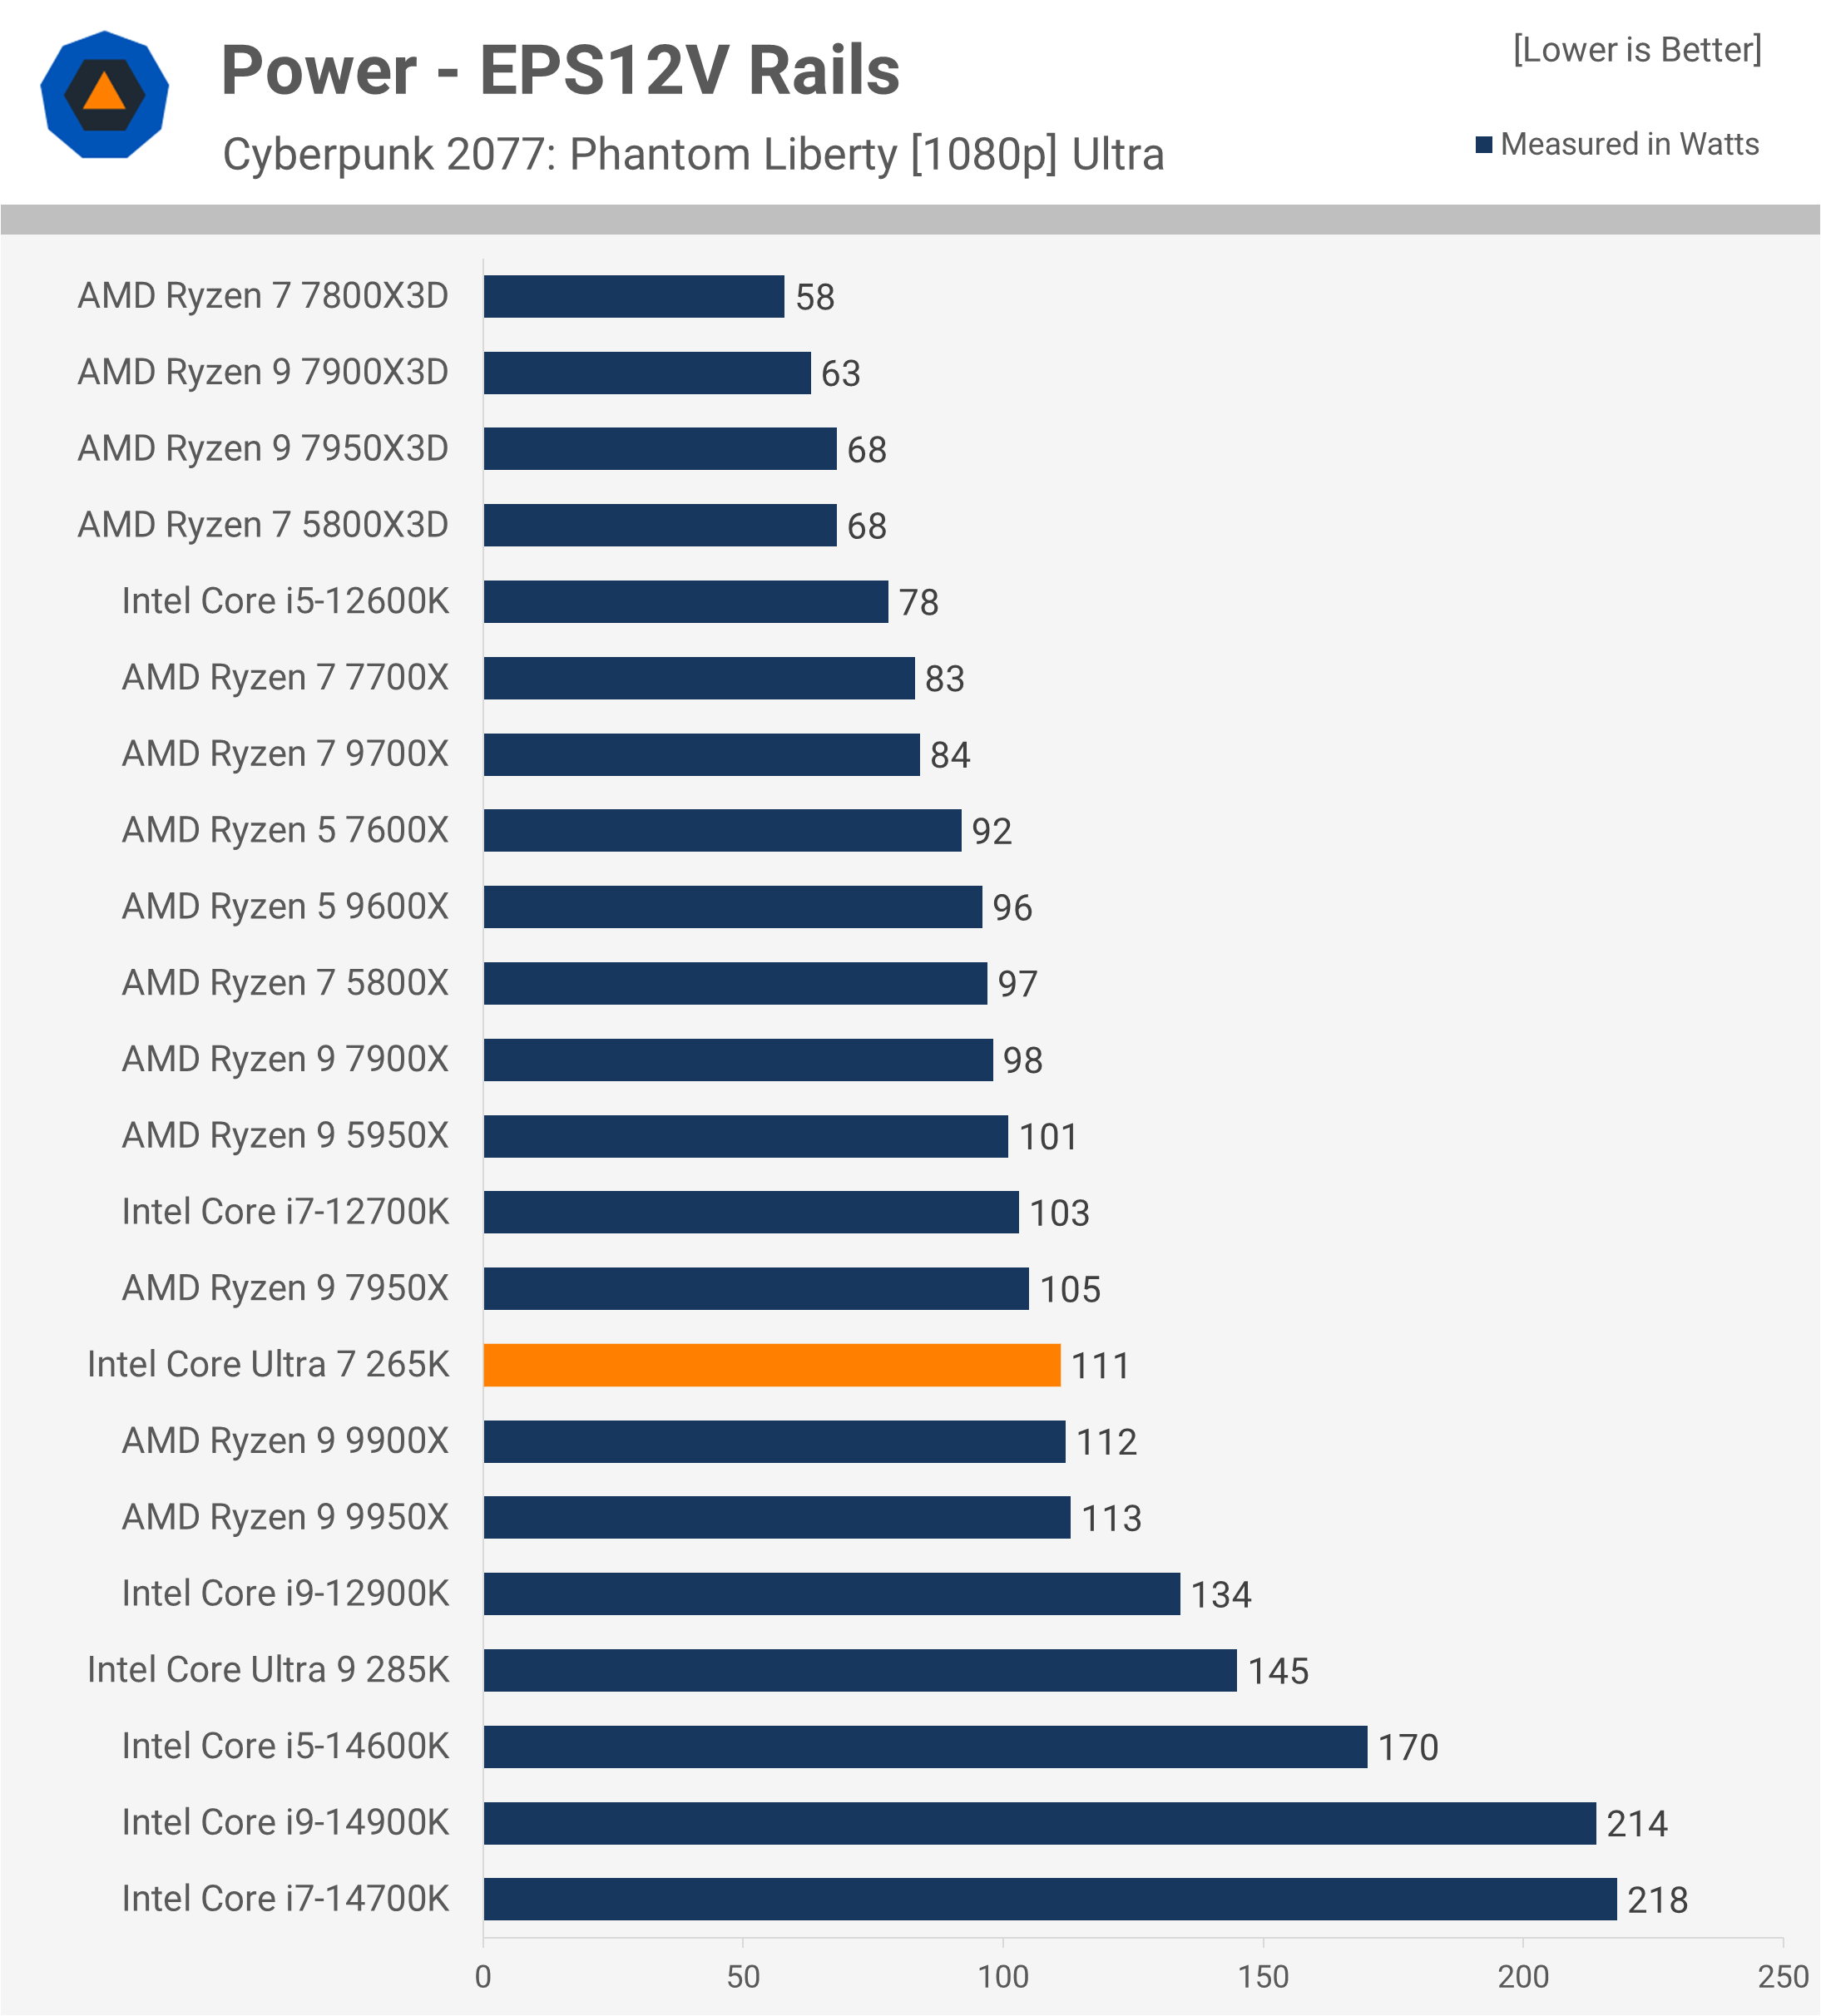
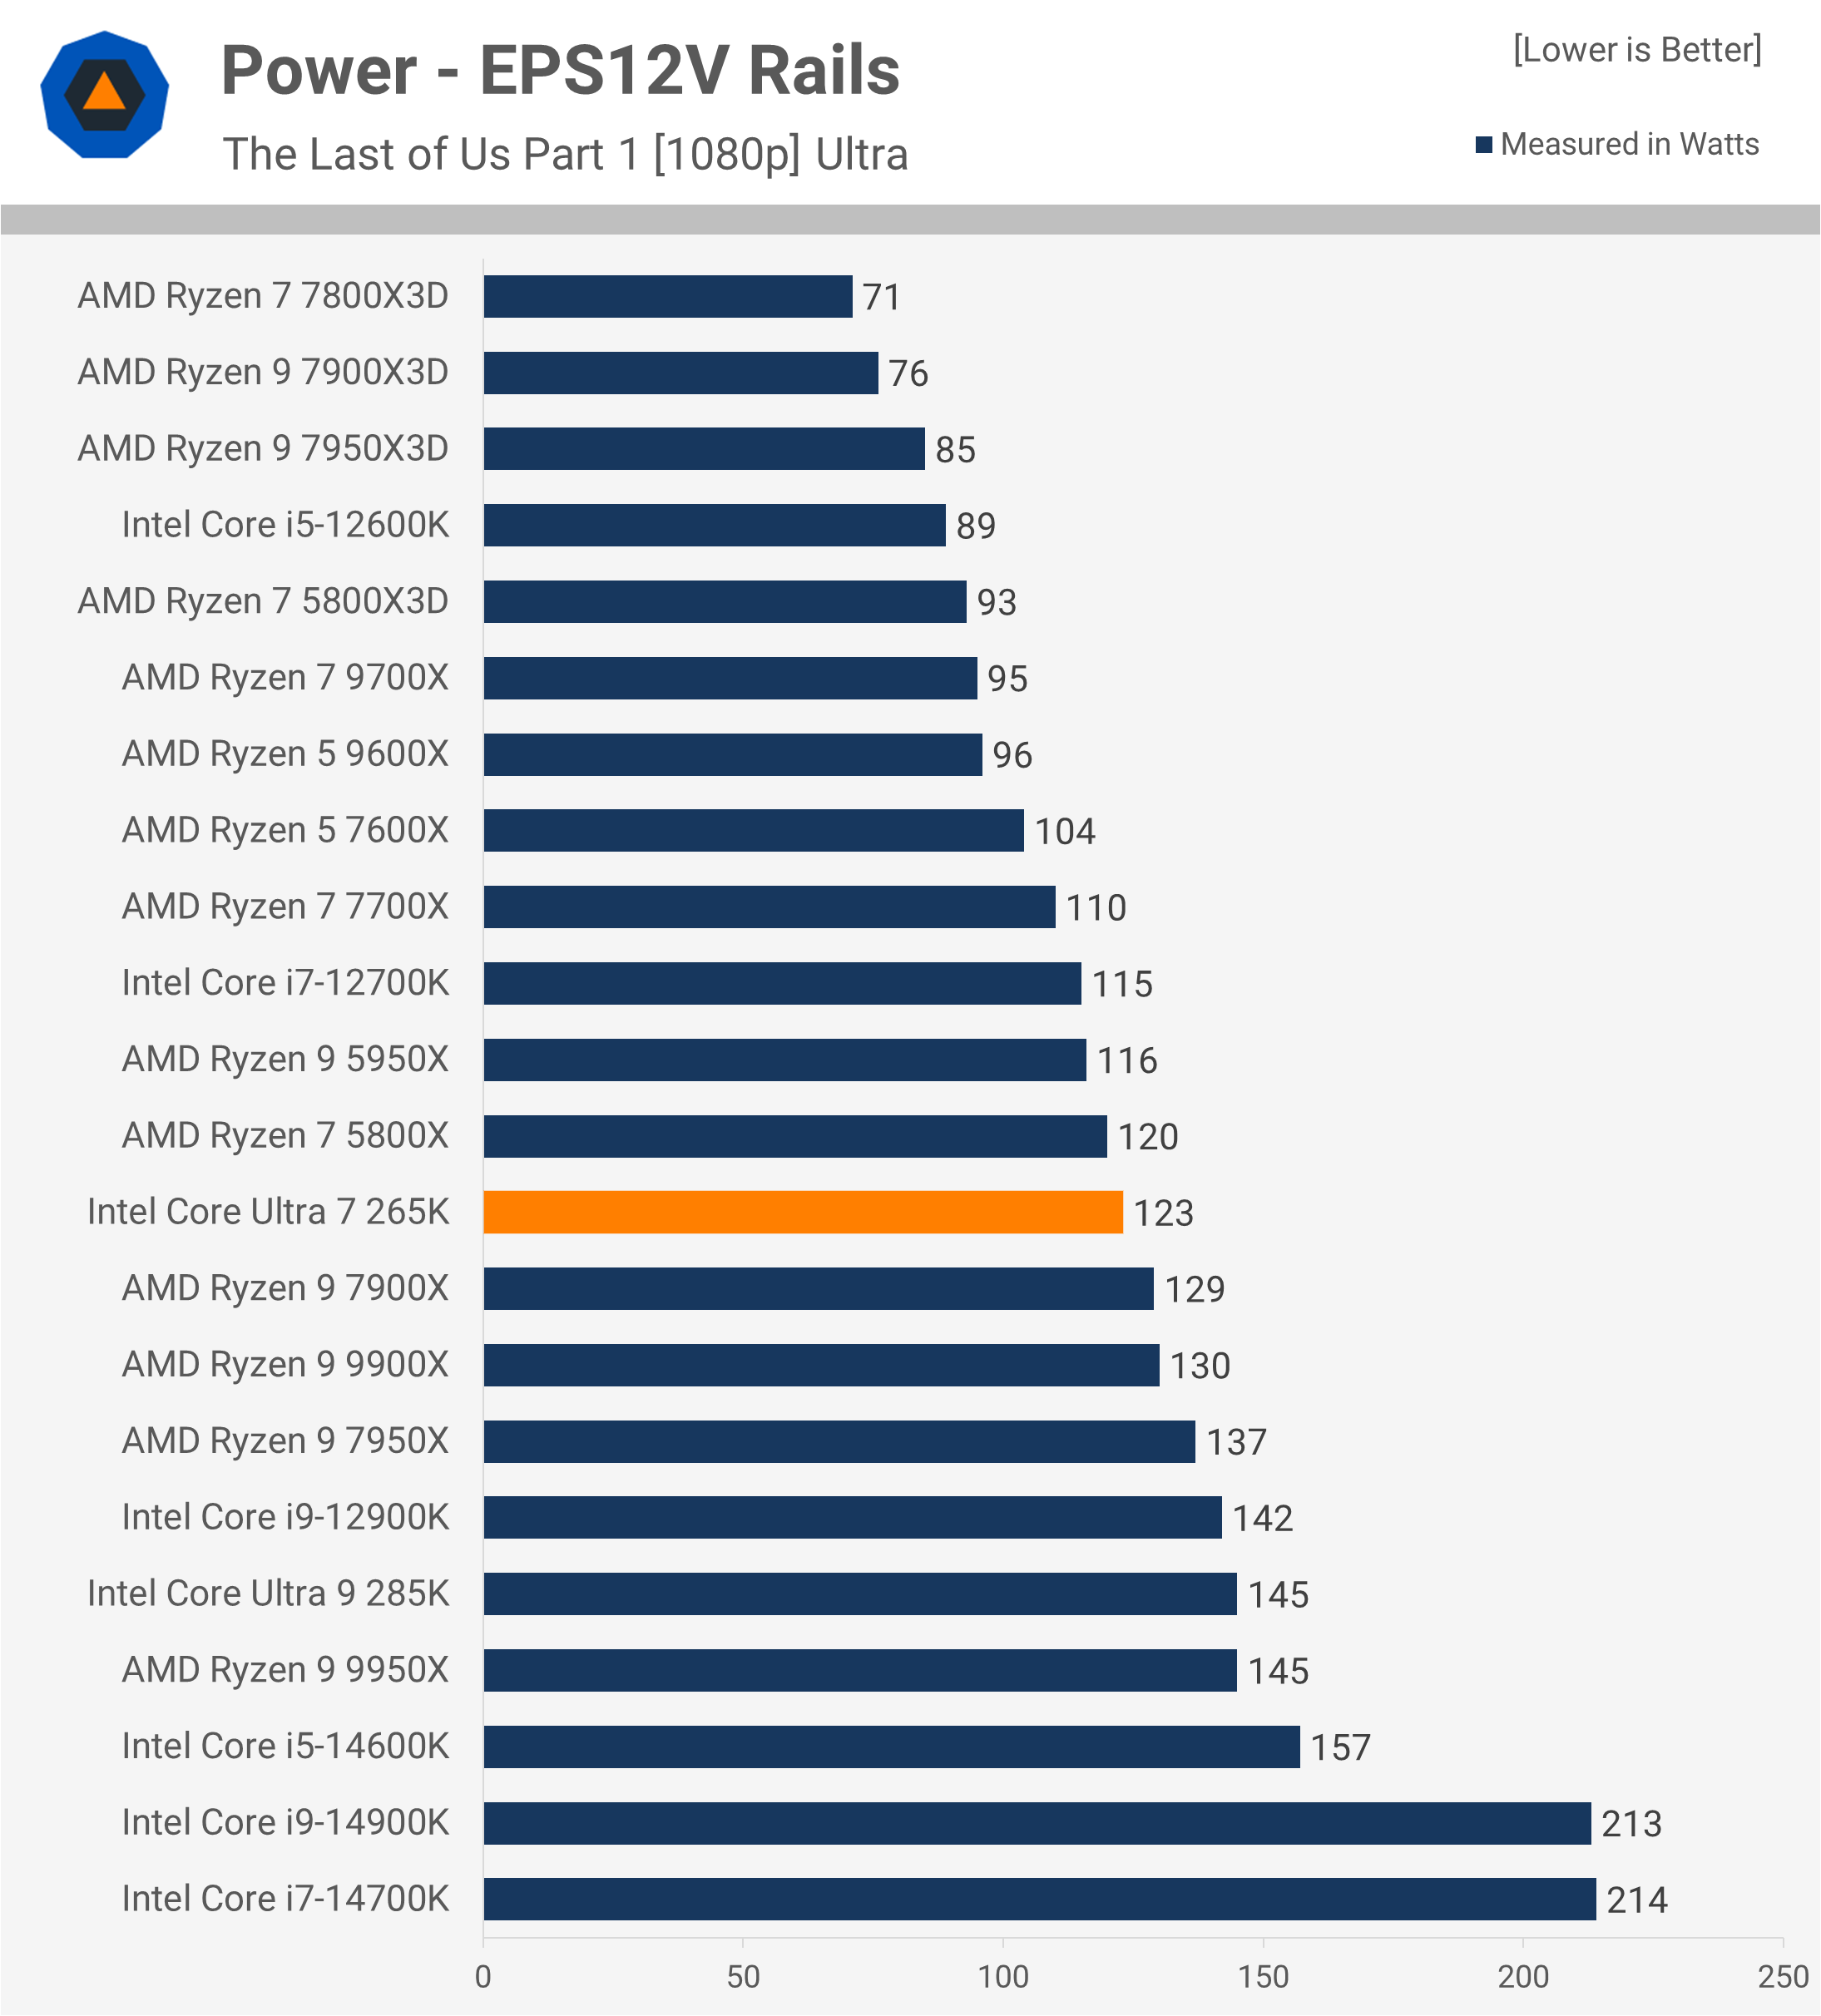
In terms of power consumption while gaming, the 265K is comparable to the 9900X, as observed in the Cyberpunk benchmark. However, because performance was subpar in the benchmarked section, The Last of Us Part 1 provides a better measure of power efficiency.
In The Last of Us, the 265K consumes 5% less power than the 9900X while delivering 12% more performance, an excellent result. However, it consumes 45% more power than the 7950X3D while providing slightly lower fps, which highlights a less optimal efficiency.
14 Game Average
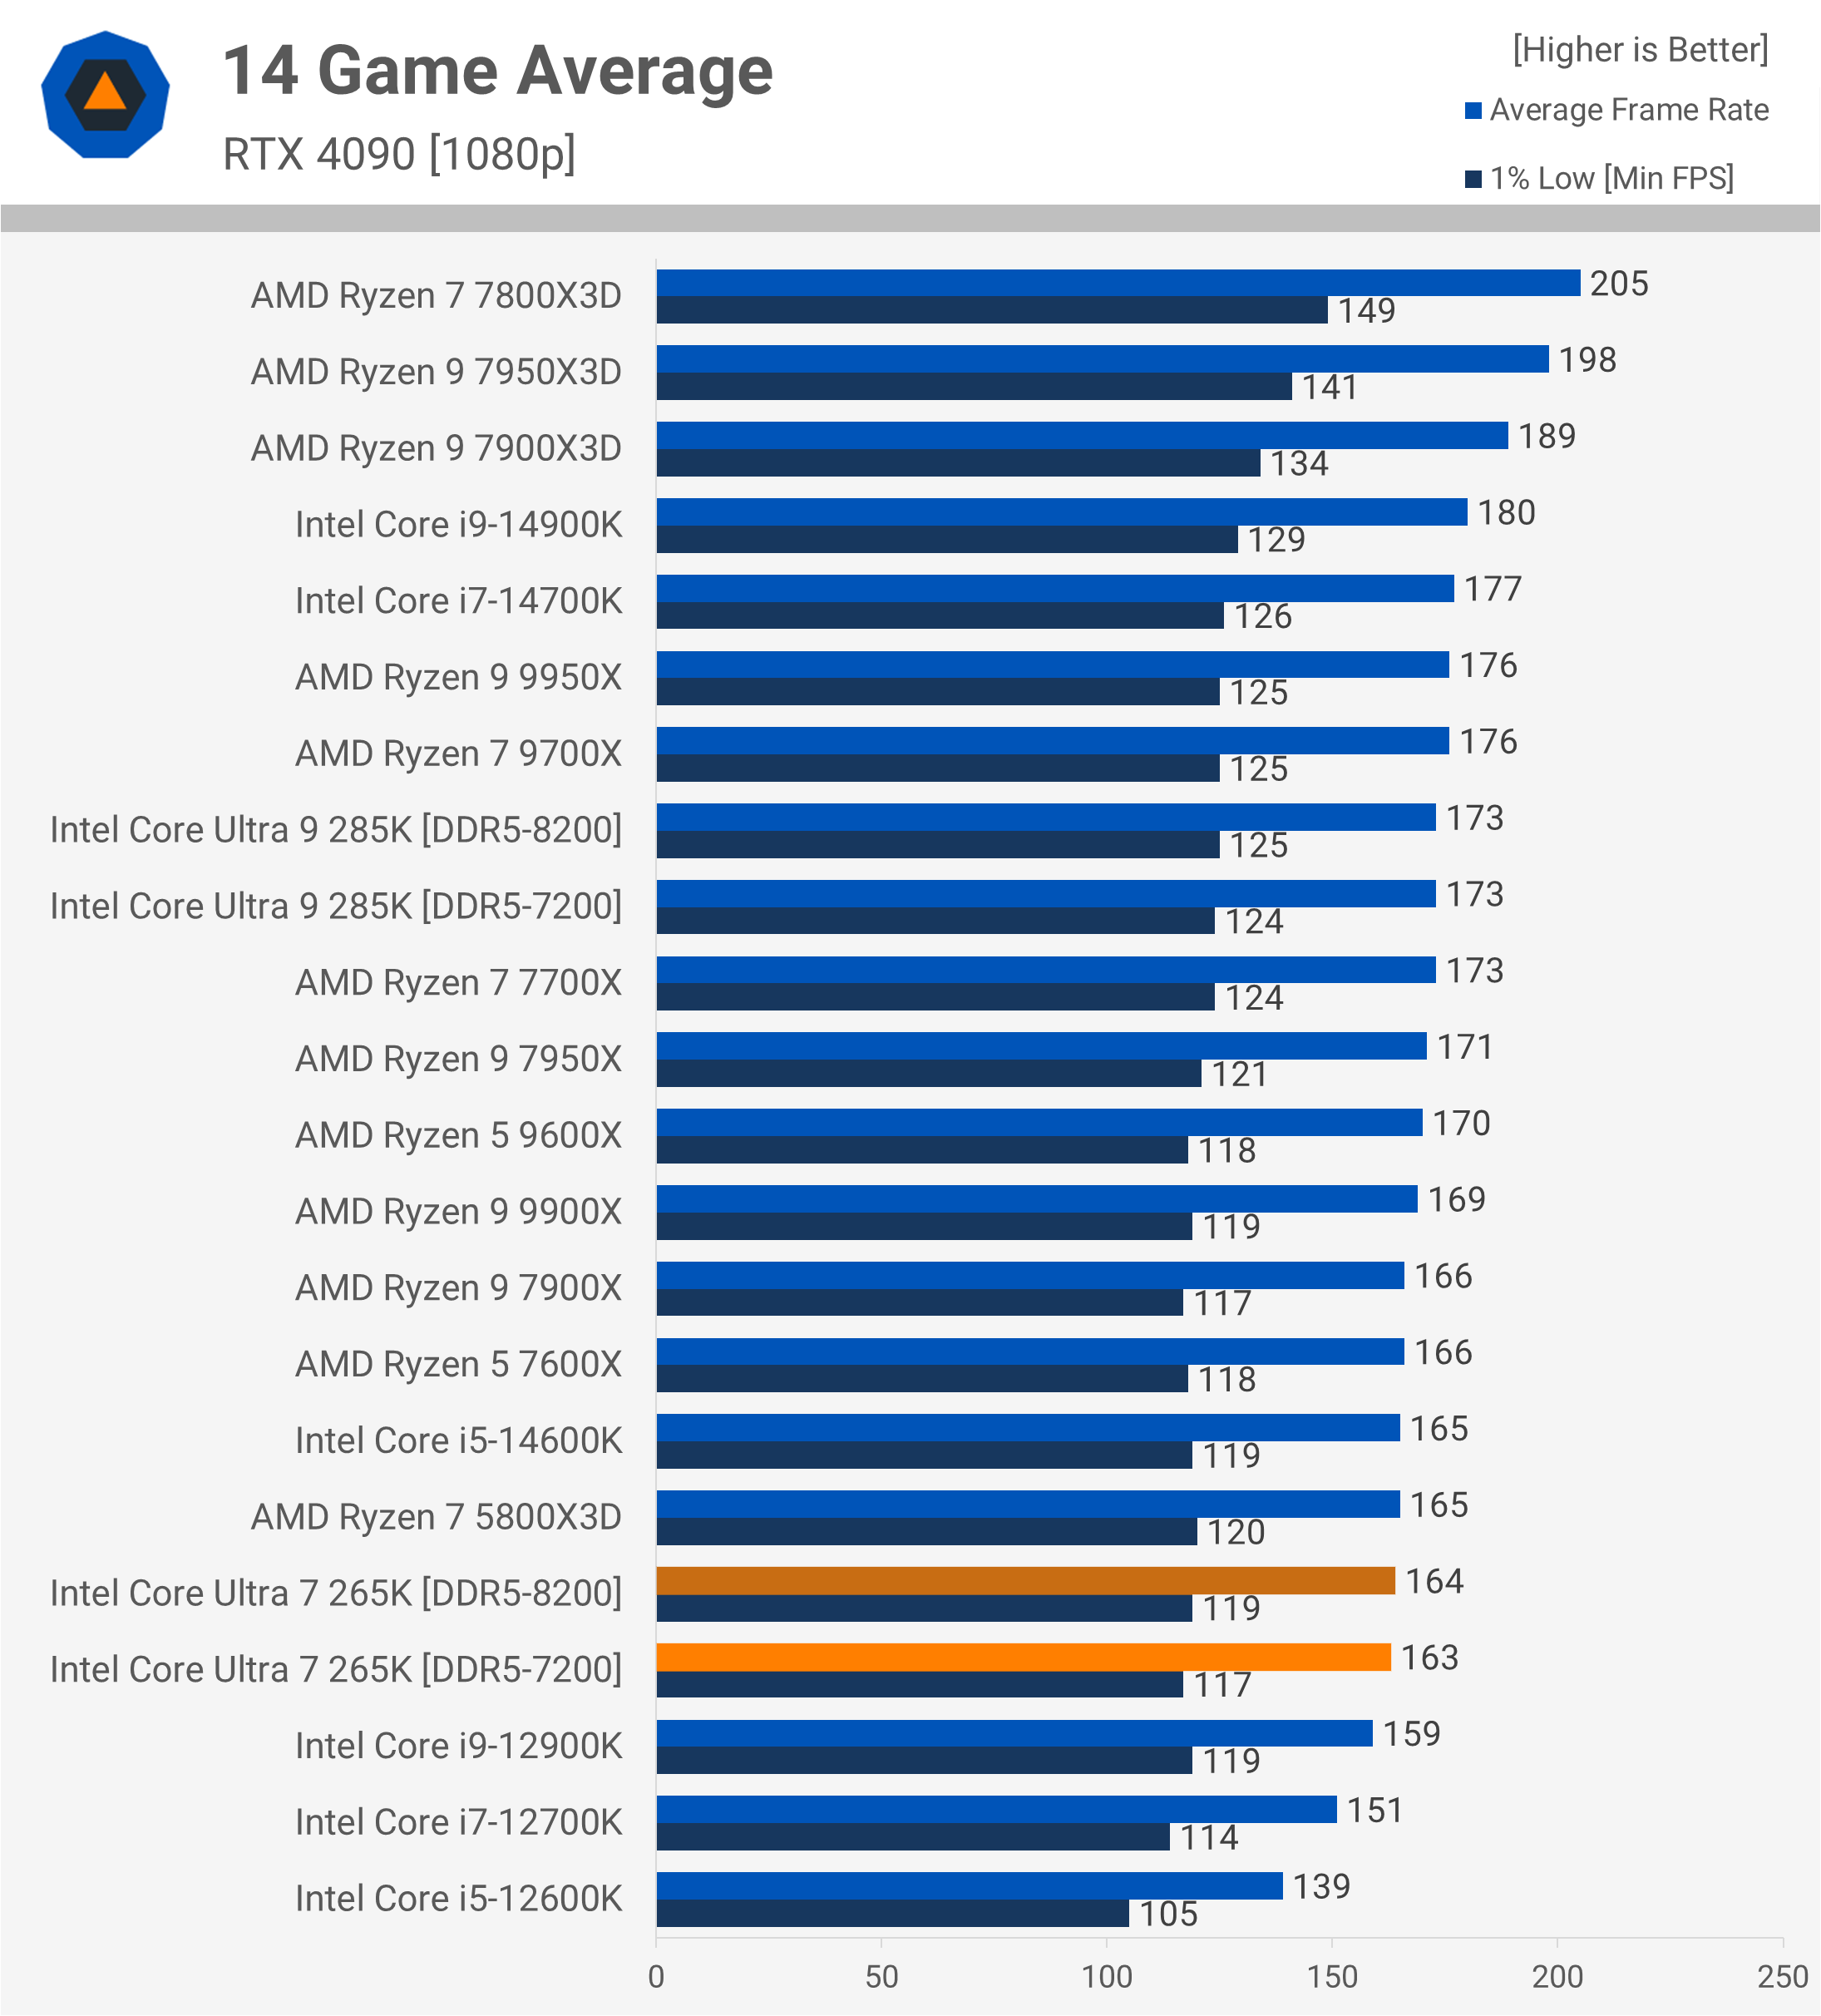
Here’s the 14-game average data, and as expected, the Core Ultra 7 265K does not perform well, landing 8% slower than the 14700K and 4% slower than the 9900X. As mentioned, the Ryzen 9 processor isn’t known for being a top gaming CPU.
It’s also wild to consider that just a few months ago, the 7800X3D was available for $340, so let’s now review the cost-per-frame data based on current retail pricing.
Despite efforts to improve performance in Homeworld 3 and Cyberpunk 2077, Arrow Lake continues to underperform in gaming.
Cost Per Frame
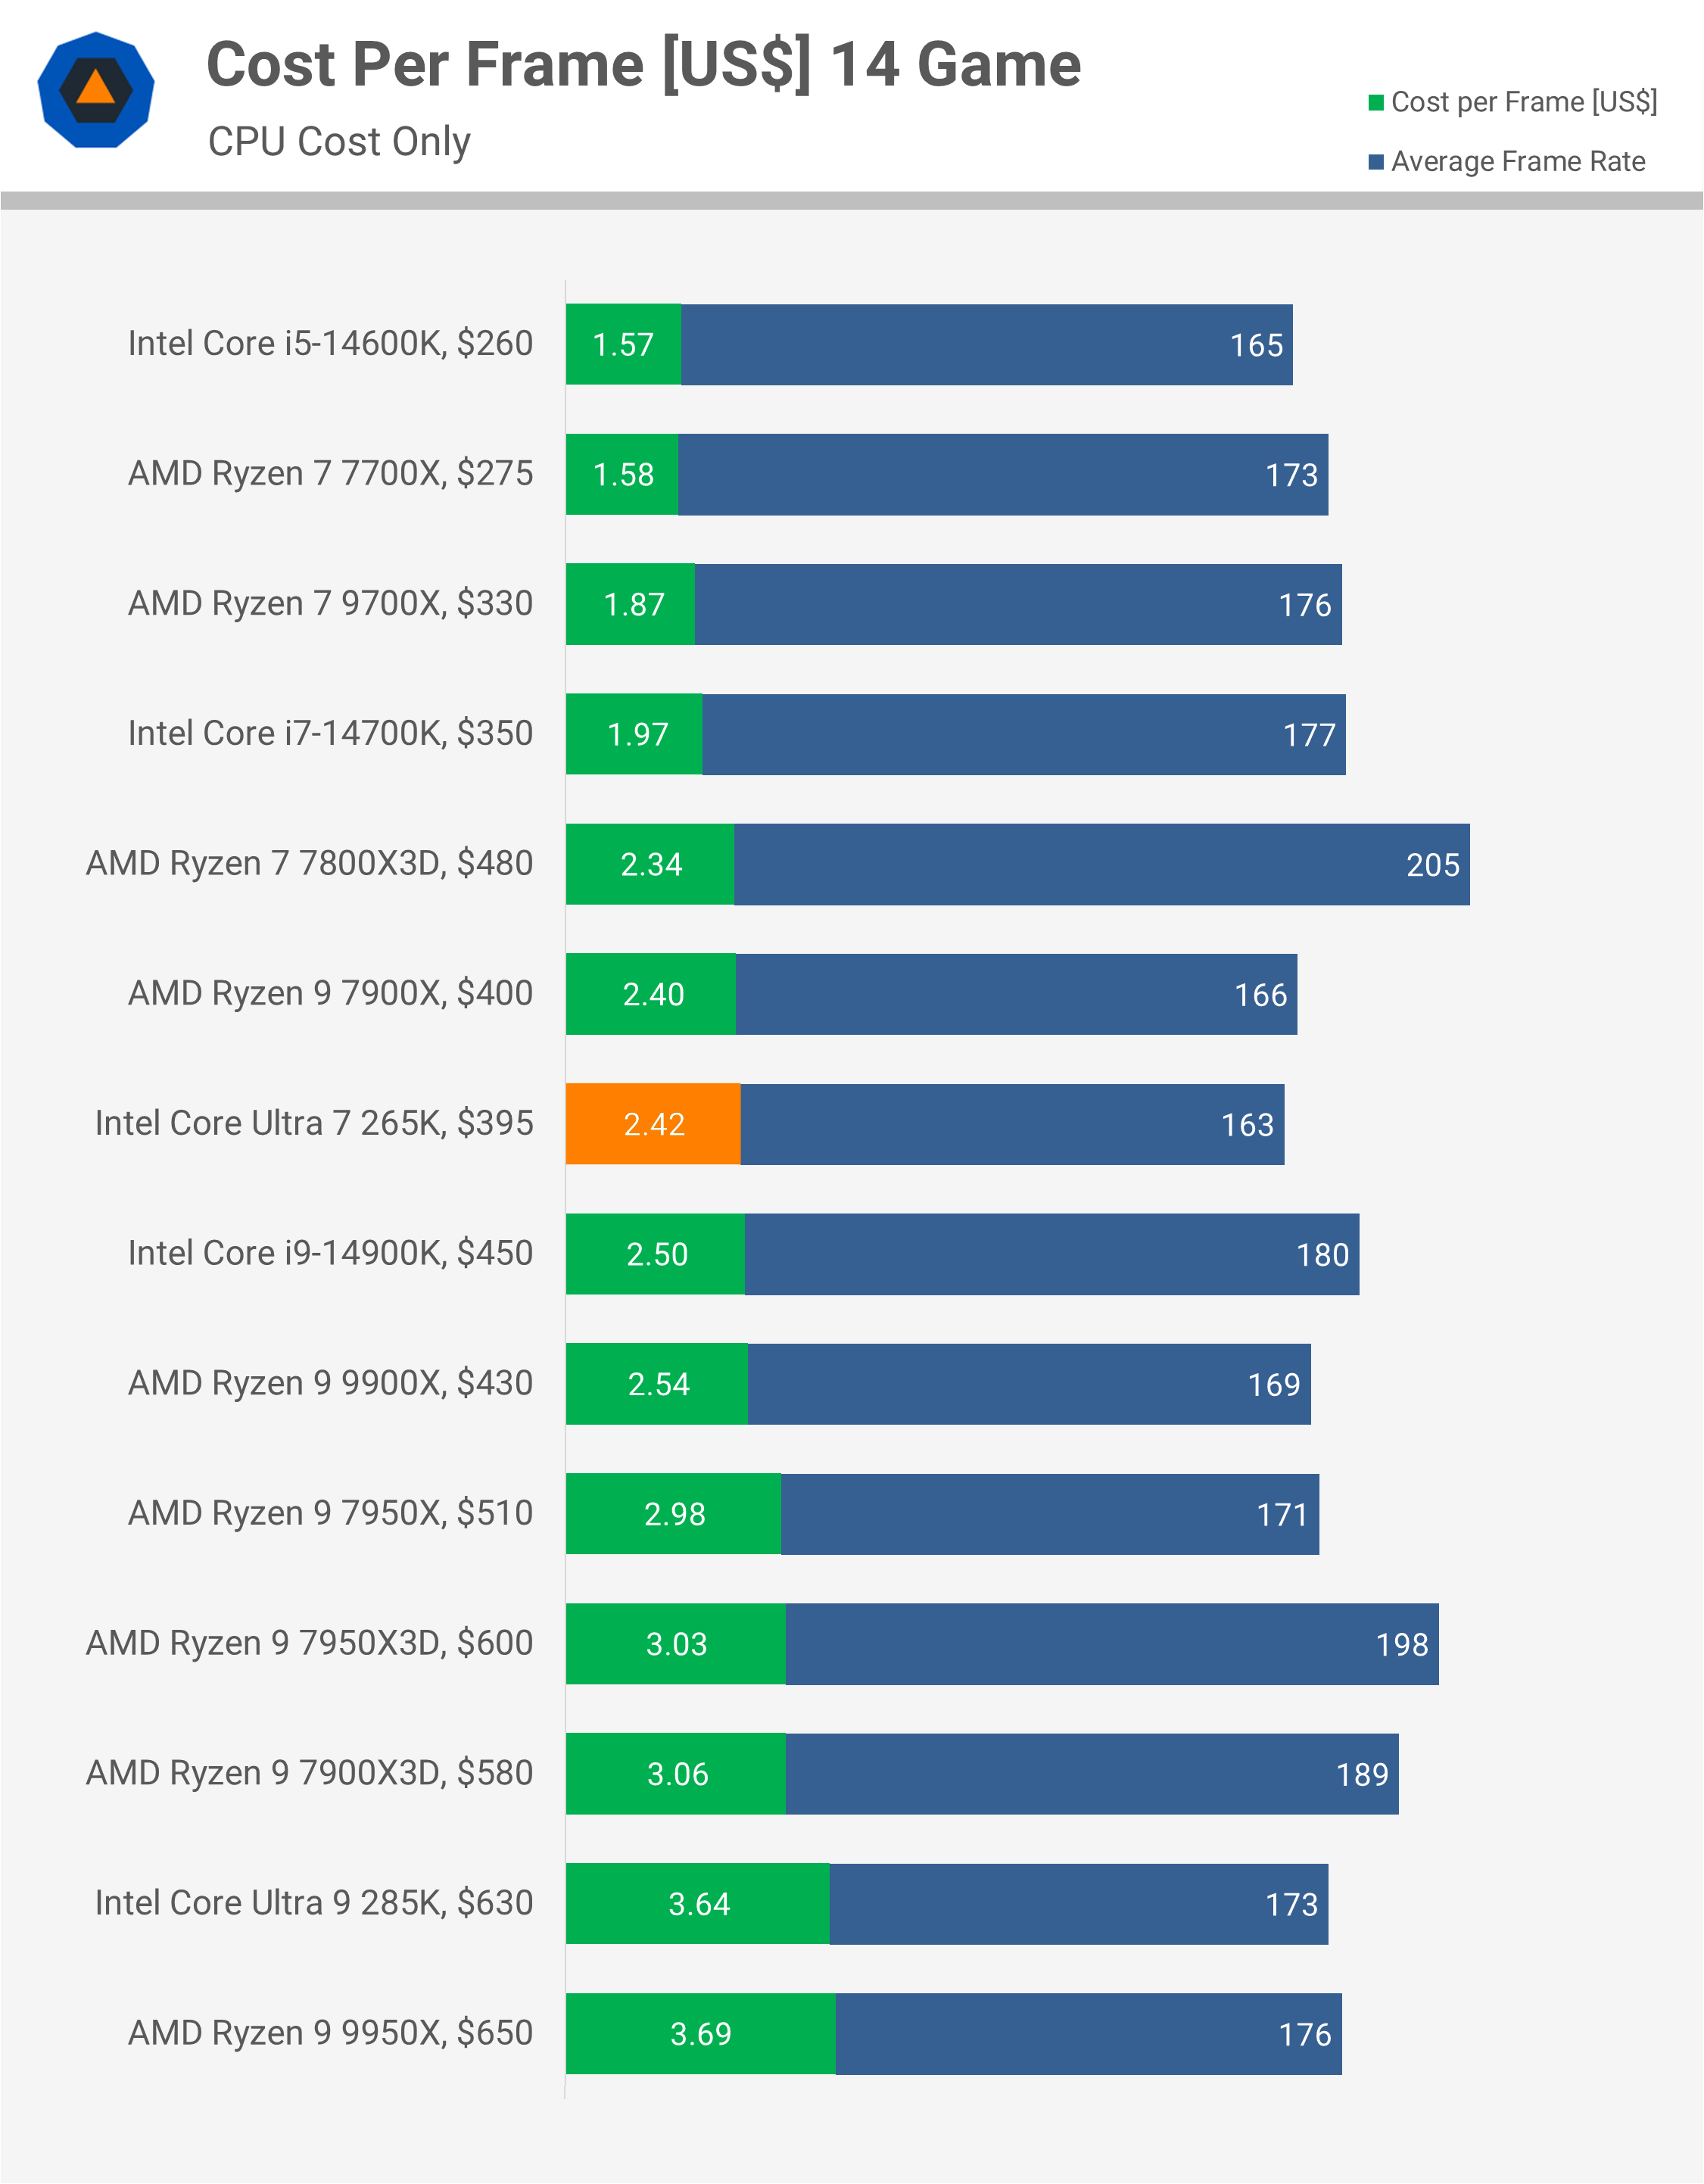
In terms of value, the Core Ultra 7 265K fares better than the 285K, primarily because it costs almost 40% less while being only 5% slower across the 14 games tested. This positions it similarly to the 9900X, offering slightly better value overall. However, as noted several times, the 9900X isn’t the ideal choice for gaming, and there are better options available.
The 7800X3D, despite its current price of $480, still offers 4% better value than the 265K and generally delivers significantly better gaming performance. The real setback for the 265K, however, is the Ryzen 7 7700X, currently priced at just $275, making it 35% better value.
The 265K also fails to offer better value than existing 14th-gen models, such as the 14700K, which has nearly 20% better value, and the 14600K, which is not only faster overall but also 35% better value. In short, the 265K underwhelms.
What We Learned
Following our Core Ultra 9 285K review, the outlook for the 265K remains largely the same. Sure, those Homeworld 3 numbers look a lot better now, but that does essentially nothing to improve gaming performance as a whole. Overall the gaming performance for the series is underwhelming.
If you cherry-pick the games, or test certain titles like Cyberpunk and A Plague Tale: Requiem under light CPU loads, it’s possible to produce results that allow Arrow Lake to match Raptor Lake, providing the parity that Intel promised. But as we found in our 285K review, if you place these Arrow Lake CPUs under heavy gaming loads, Arrow Lake CPUs tend to falter.
Whether Intel can address this remains uncertain, but we certainly hope so; otherwise, Arrow Lake may turn out to be an epic fail for PC gamers and enthusiast builders.
So far, the greatest improvement in Arrow Lake is its power efficiency, which was expected, though we’d hoped for stronger gaming performance. The 265K is more efficient than the 285K and is comparable to the 12- and 16-core Ryzen models, excluding those with 3D V-Cache like the 7950X3D.
For what will be around $400 on retail, the Core Ultra 7 265K is essentially dead on arrival, even if Intel fixes gaming performance and genuinely finds parity with the 14700K, at that point you’re looking at 7700X-like gaming performance for a 45% price premium. For a better balance of gaming and productivity, the 7950X3D remains a more appealing choice at $480. And with Zen 5-based X3D chips just around the corner, the 265K and 285K will face even stiffer competition.
As we said when wrapping up our Core Ultra 285K review, we fully expect Intel to iron out the kinks over the coming weeks, which should help, but we can’t imagine it’s going to be enough to save Arrow Lake for gamers, and we really hope we’re wrong about that.


